
SVC-Update
Weekly Recap & Outlook

No financial advice.
Hope vs. Reality
What I’ve observed in equities over the past few weeks hasn’t been driven by fundamentals, but rather by two forces: hope vs. reality.
This dynamic was once again clearly visible this week. We started with headlines the U.S. also moved to block the Strait of Hormuz, potentially intercepting and restricting Iranian vessels heading toward China. At first glance, the idea seems questionable, but the implications are significant. Estimates suggest that around 30 to 45% of Iran’s revenues come from oil exports. At the same time, China, which is heavily dependent on imported oil, would also feel the impact of such a disruption.
Markets initially priced this as an escalation at the open, but the move was quickly reversed.
Midweek, stronger than expected producer price inflation data, combined with renewed hopes of de-escalation, pushed the S&P 500 to new all time highs. One key driver behind the sharp move from minus 8% to plus 3% within just 13 trading days has likely been positioning. CTAs and market makers, operating in a positive gamma environment, were forced to buy both dips and rallies to maintain hedged books.
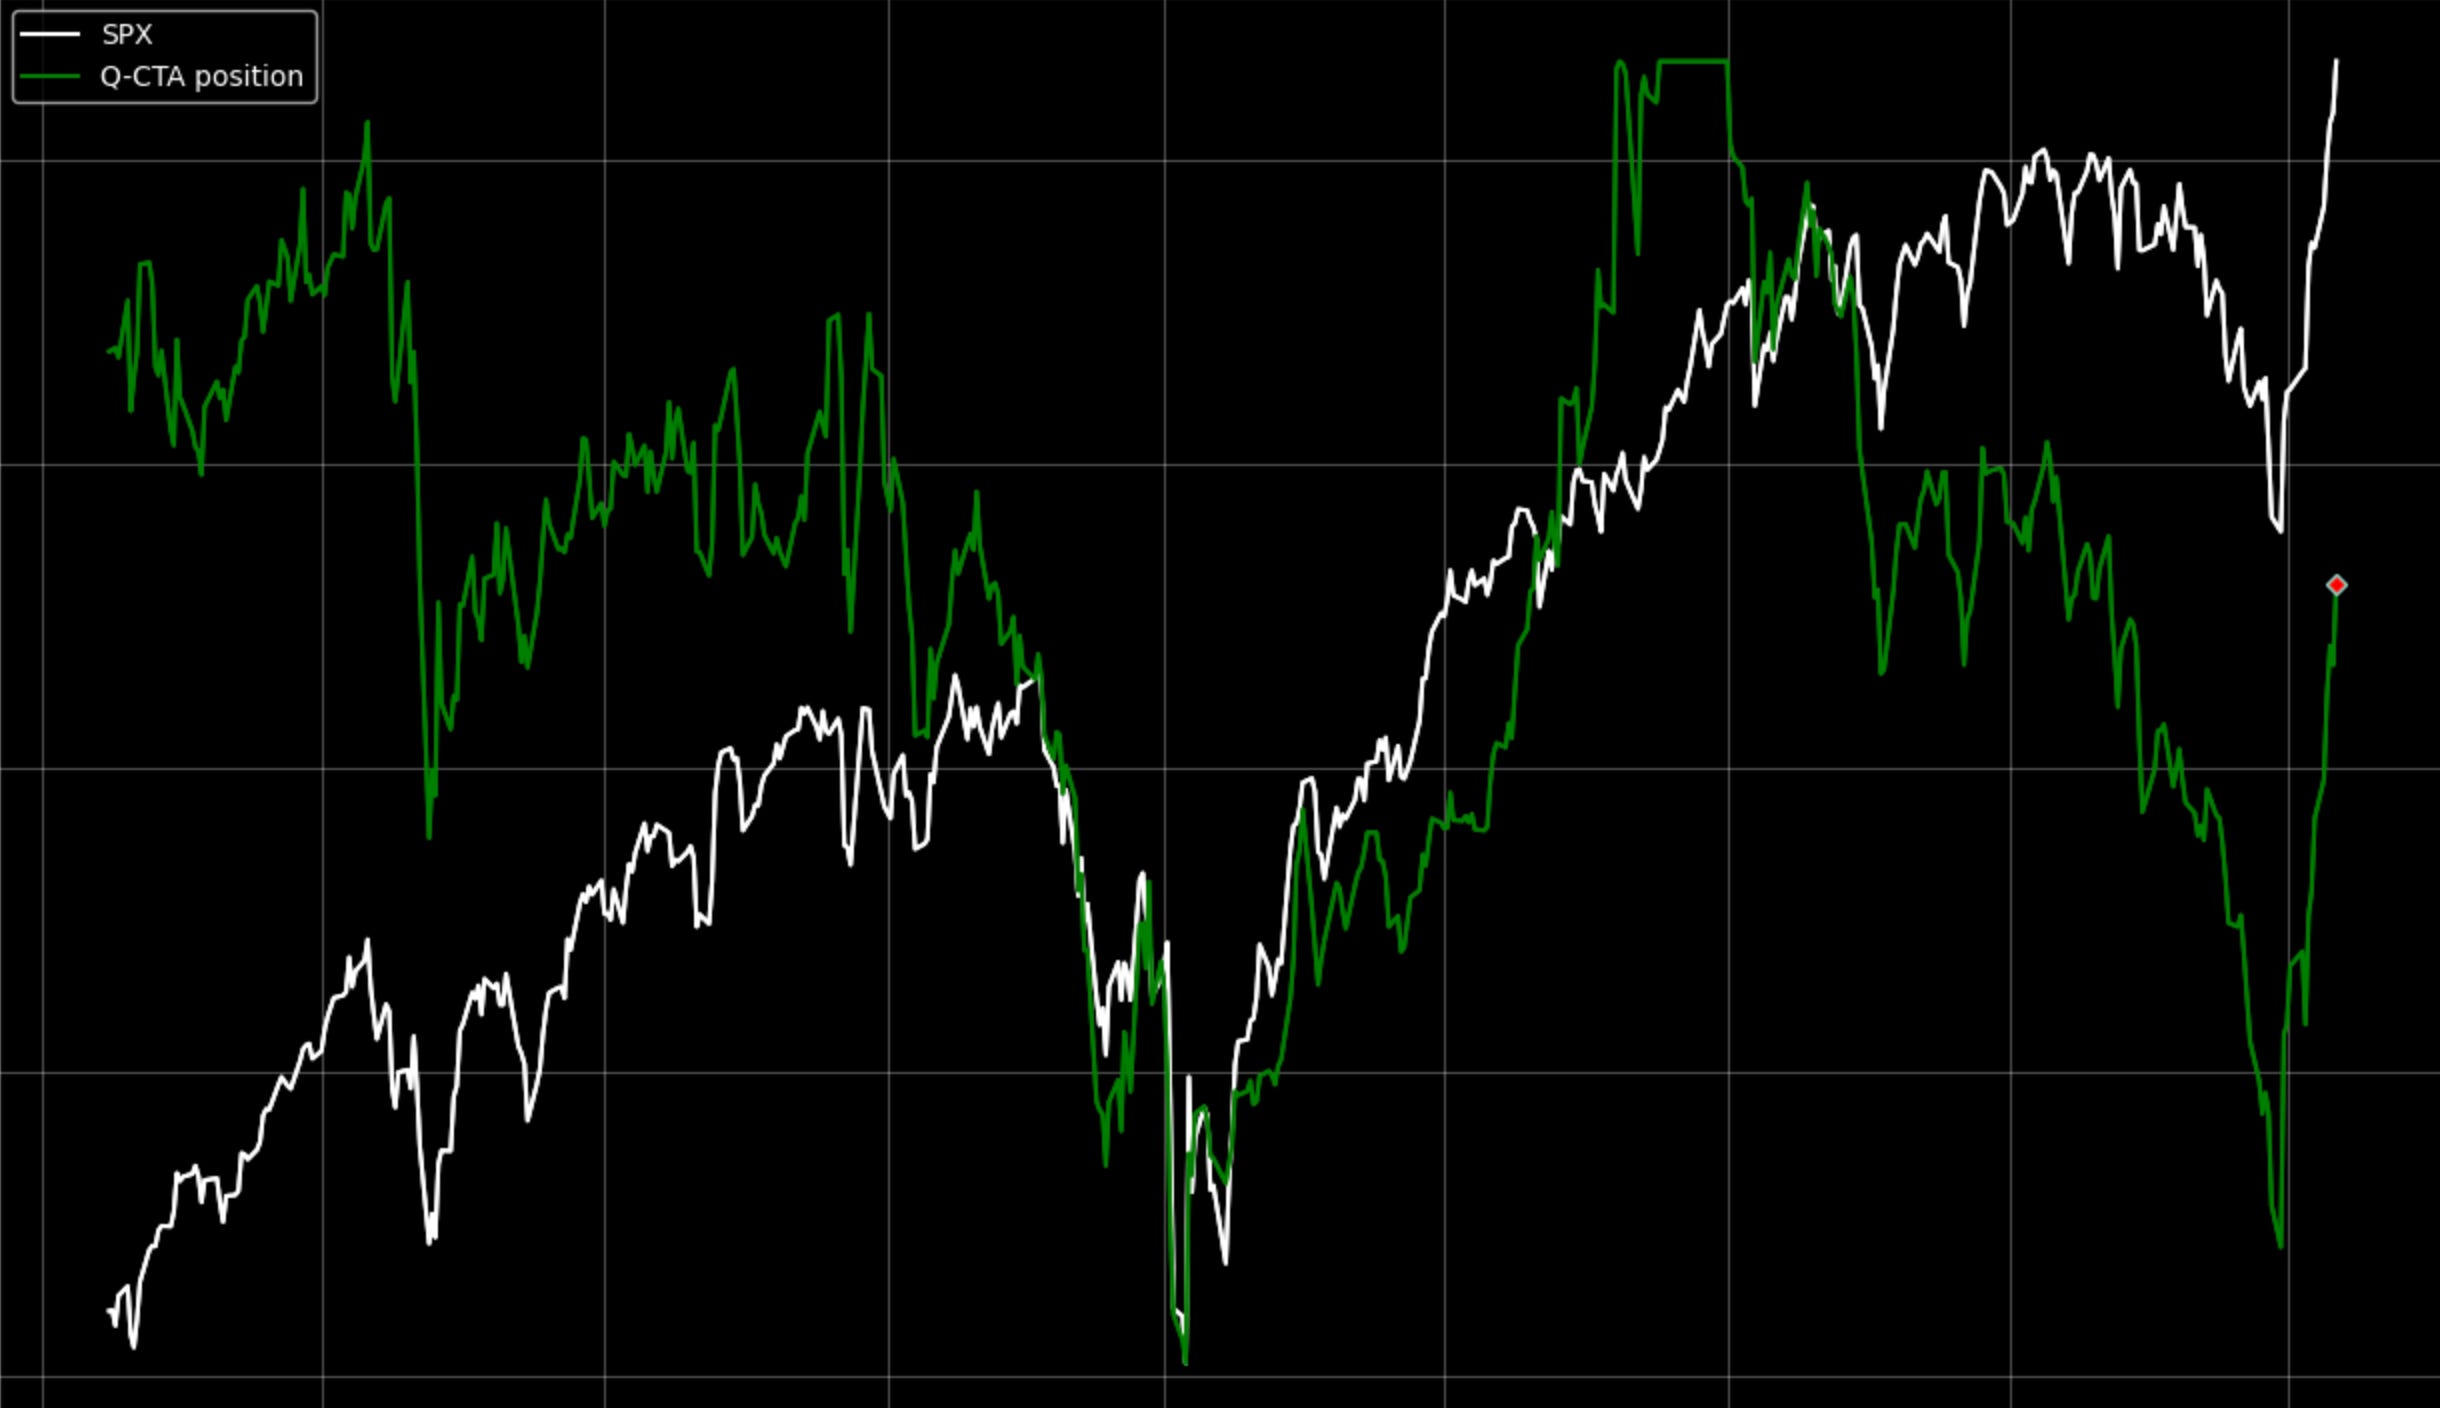
As a result, even slightly positive news had a strong impact on the upside, while negative headlines were absorbed relatively quickly.
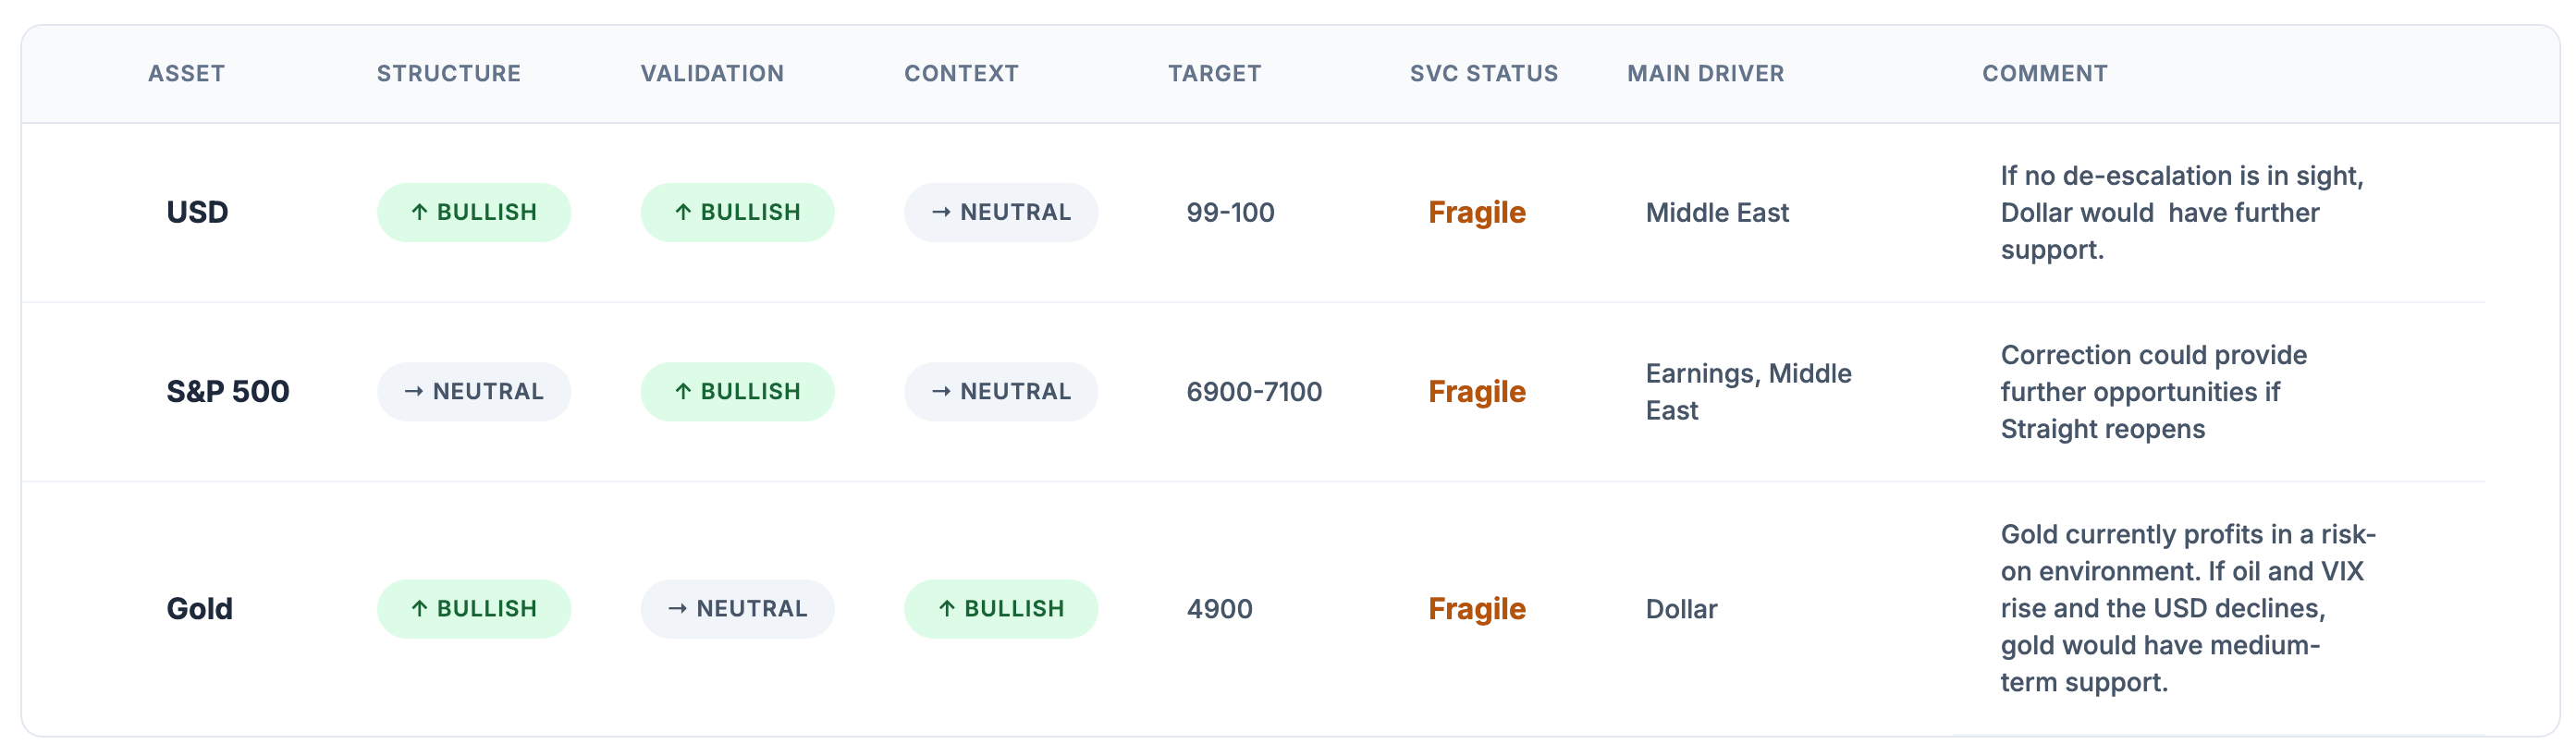
Looking ahead, gamma exposure is expected to remain positive in the coming weeks, suggesting continued structural support for the market. Current GEX levels indicate potential put support around 6,800 on the S&P 500, with call resistance near 7,200.
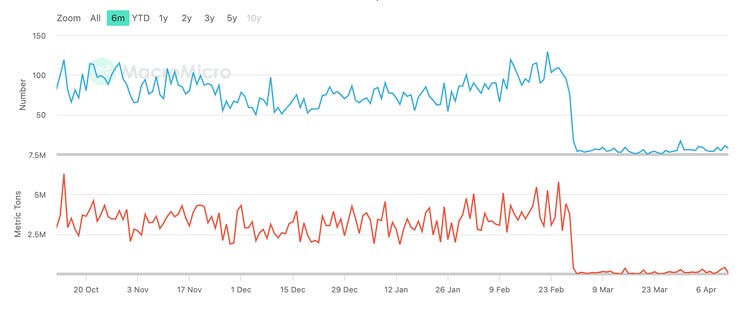
However, weekend headlines suggest that hopes for a resolution of the conflict may be premature. Trading purely based on headlines increasingly resembles a coin toss. What remains worth monitoring, though, is the flow through the Strait of Hormuz, which continues to operate at record lows.
A definitive reopening would likely ease pressure on the Federal Reserve and other central banks. In such a scenario, the Fed could still deliver another rate cut this year.
On the other hand, a prolonged disruption would complicate the outlook, even for more dovish policymakers, and could reinforce a higher for longer stance. Further escalation could even force rate hikes globally, which would likely erase recent gains in equity markets rather quickly.
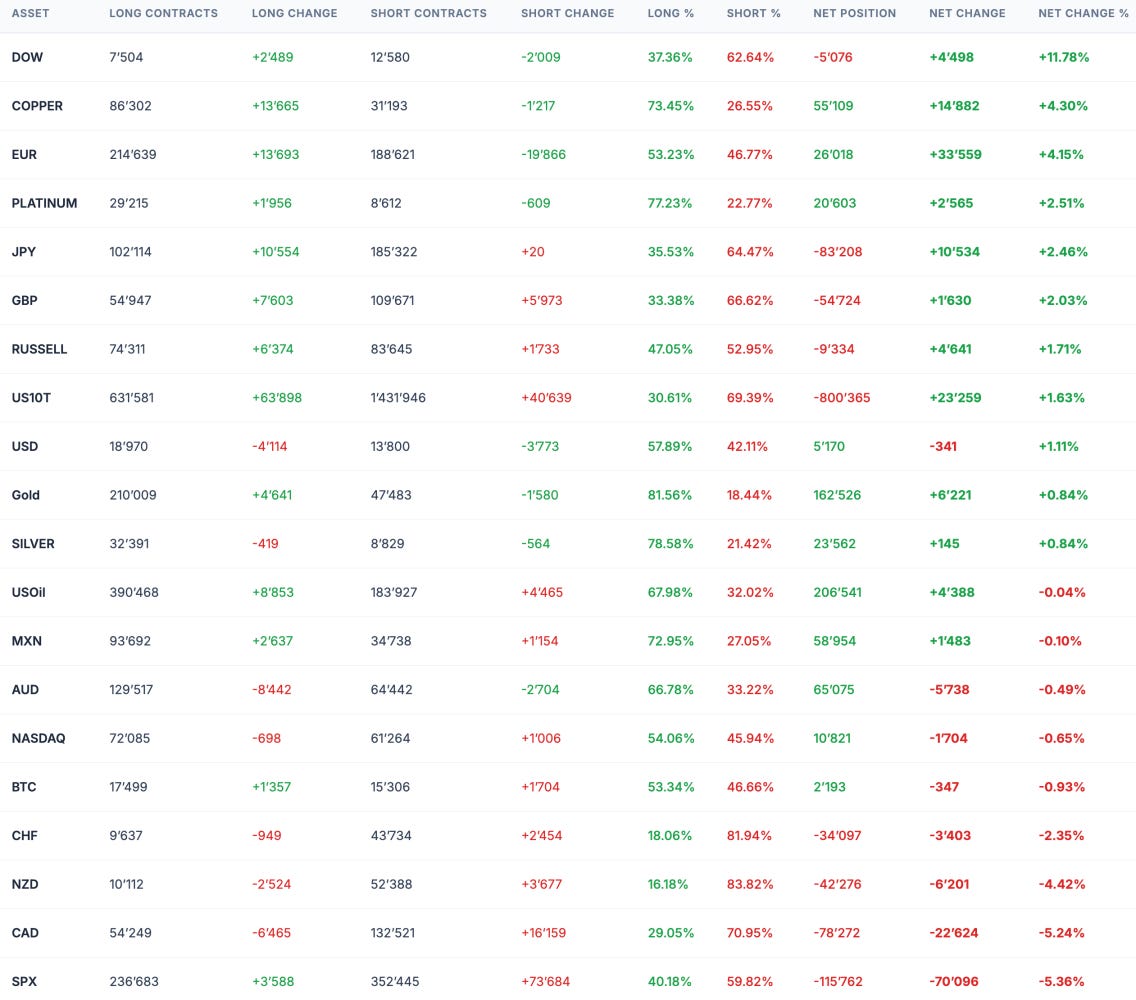
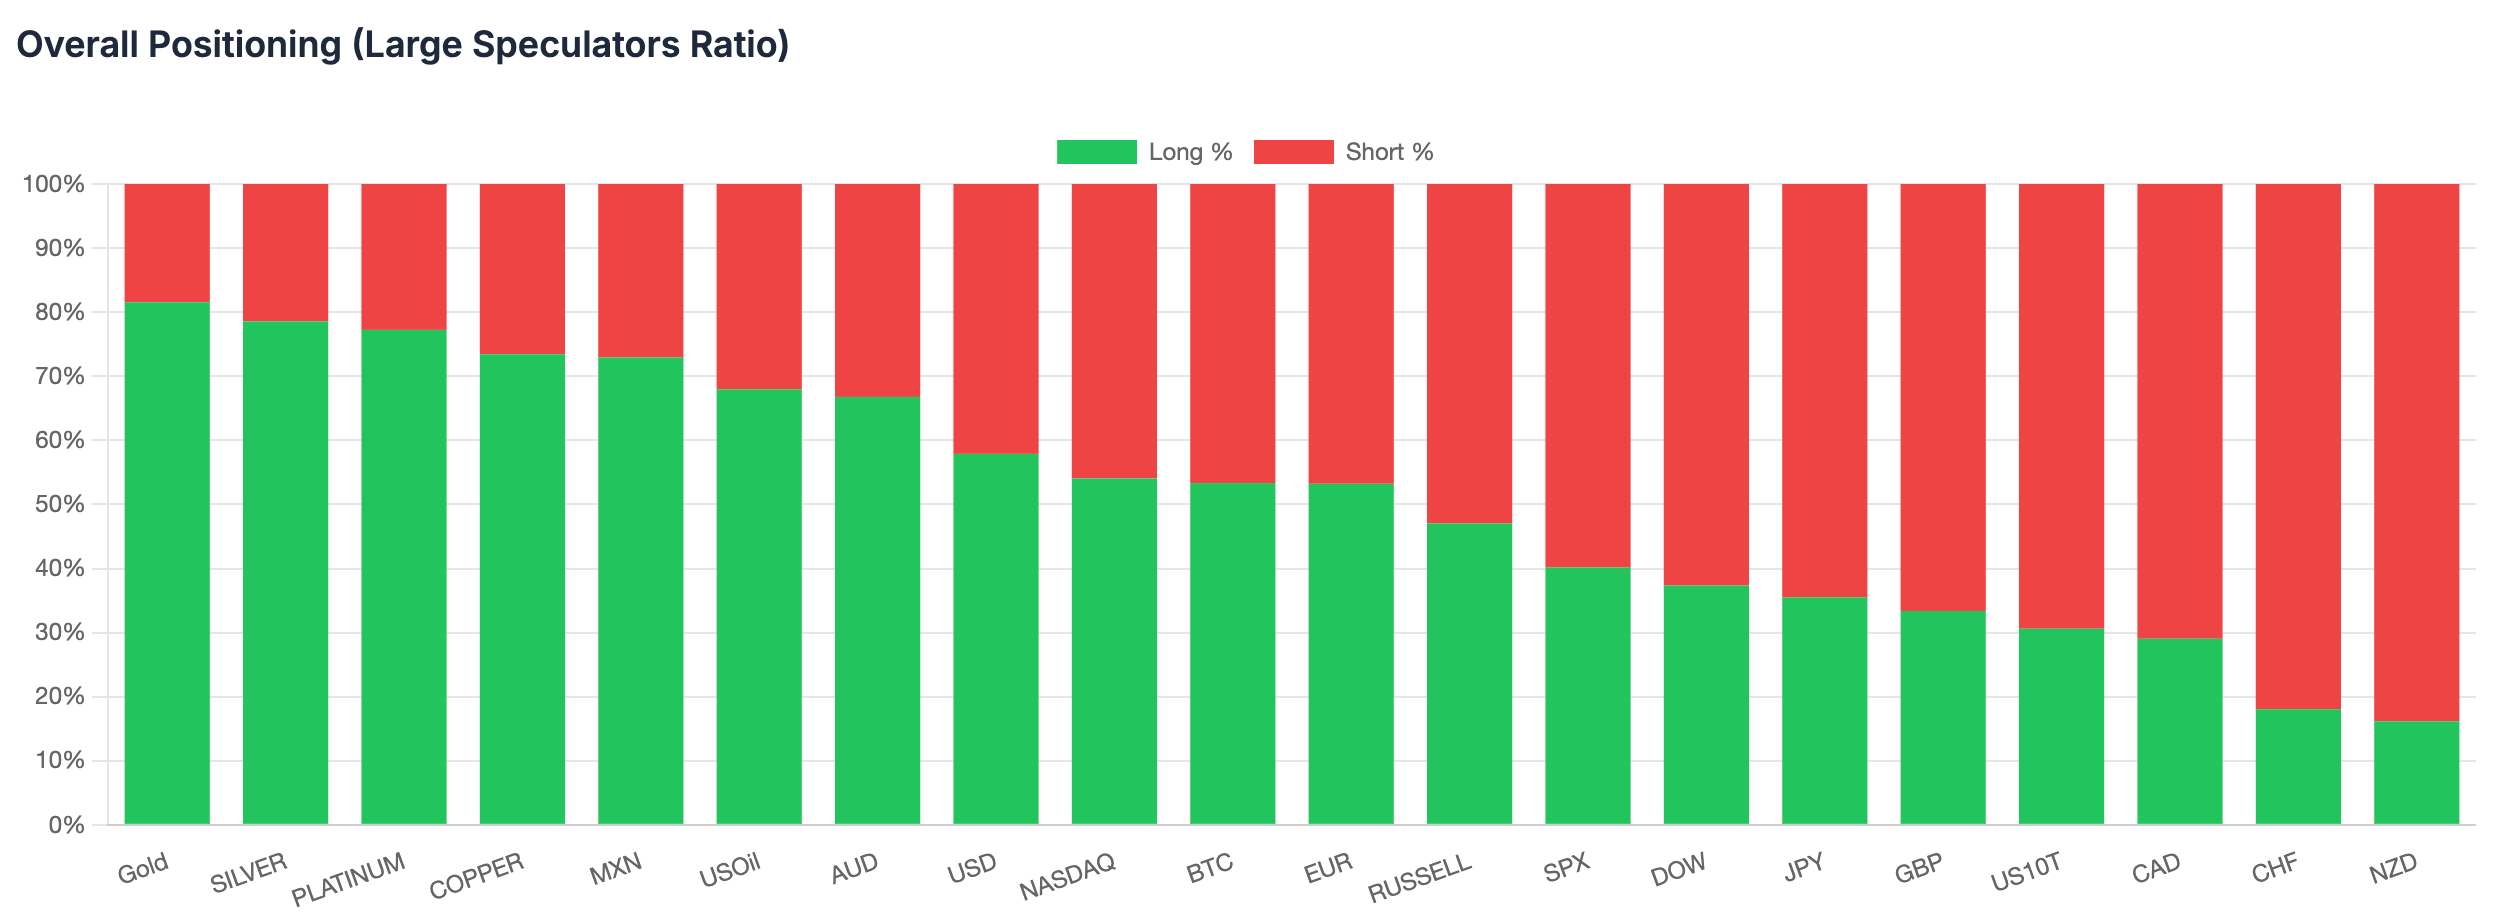
Institutional Positioning
Before turning to this week’s macroeconomic data, below is an overview of recent positioning shifts across major asset classes, based on our proprietary Gauch Research COT Visualizer.
US Producer Price Inflation m/m (Previous: 0.5%, Forecast: 1.1%, Actual: 0.5%)
In March 2026, US producer prices experienced a 0.5% month-over-month increase, matching the growth rate of the previous period. However, this growth fell short of the market’s expectations of 1.1%. Goods prices surged by 1.6%, marking the largest increase since August 2023. This surge was primarily driven by an 8.5% jump in energy costs, largely attributed to the ongoing Iran conflict. On the other hand, final demand food prices declined by 0.3%.
In the services sector, prices remained unchanged after a 0.3% increase in February. Within this category, transportation and warehousing costs rose by 1.3%, while other final demand services saw a 0.1% increase. These increases offset a 0.3% decline in trade service margins.
Year-over-year, producer prices rose by 4%, the largest increase since February 2023. However, this growth still fell short of the expected 4.6%. The core index, which excludes food, energy, and trade services, experienced a 0.2% month-over-month increase. This growth rate was slower compared to the 0.5% gains seen in both January and February. Nevertheless, the core index climbed 3.6% year-over-year.
UK GDP m/m (Previous: 0.1%, Forecast: 0.1%, Actual: 0.5%)
The UK’s GDP grew by 0.5% month-on-month in February 2026, surpassing expectations and January’s revised 0.1% growth. This marks the strongest growth since January 2024, with services contributing 0.5% to the growth (up from 0.1% in January). The largest positive contribution came from administrative and support service activities, which rose by 2.0%. This growth was driven by a rebound in employment activities, which increased by 2.5%, along with gains in wholesale and retail trade and repair of motor vehicles, which saw a 0.7% increase.
However, these gains were partially offset by a 0.3% decline in accommodation and food services. Production also increased by 0.5%, reversing previous declines. This growth was supported by mining and quarrying, which saw a 3.9% increase, and energy supply, which increased by 1.5%. Construction grew by 1.0%, with private housing leading the growth. On a yearly basis, GDP expanded by 1.0%, marking the strongest growth since September last year. The latest data comes before the escalation in the Middle East. As a net energy importer, the UK is vulnerable to global energy price shocks due to disruptions in oil and gas exports in the region.
Upcoming News
US Retail Sales
CAD, GBP, NZD CPI
Flash PMI’s
Wishing you a successful trading week ahead,
David Gauch
Founder, Gauch Research