
SVC-Update
Weekly Recap & Outlook

No financial advice.
Middle-East Conflict
On the geopolitical front, markets experienced significant uncertainty last week, particularly ahead of Tuesday’s deadline, as Donald Trump escalated rhetoric to extreme levels, even threatening the destruction of an entire civilization.
Following confirmation of a ceasefire, the S&P 500 rallied sharply, gaining approximately +2.5% in a short period of time.
However, the ceasefire proved short-lived, as Israel continued targeting positions in Lebanon. The next phase of the conflict will be shaped by ongoing discussions in Islamabad.
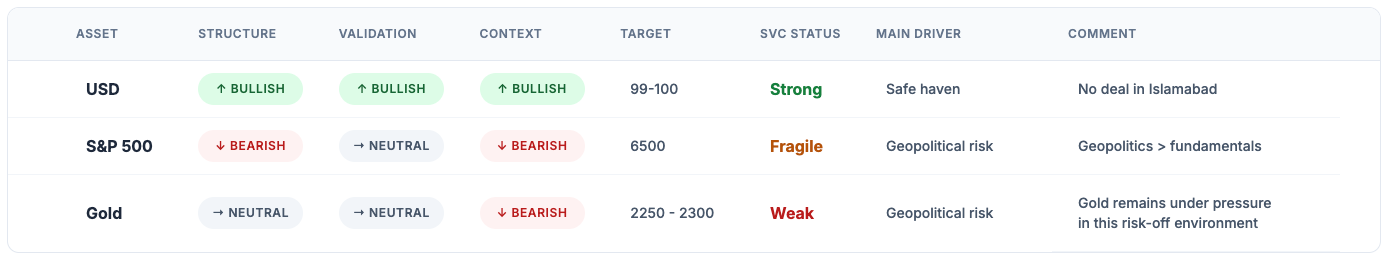
A confirmed ceasefire, or even a broader de-escalation, combined with a reopening of the Strait of Hormuz could push equities and gold higher, while weighing on the US dollar and oil prices. The inverse scenario remains equally plausible.
Despite the ceasefire, transit volumes through the Strait of Hormuz have only seen a marginal increase so far, indicating continued structural and geopolitical constraints.
As highlighted in previous Gauch Research publications, any downside in oil prices following a reopening is likely to be limited. Damage to critical energy infrastructure has structurally reduced capacity, making a return to pre-conflict levels unlikely in the near term.
At the same time, escalation risks remain elevated. Iran retains leverage through the Houthi movement in Yemen, with the potential to disrupt the Bab-el-Mandeb Strait, a critical passage accounting for roughly 12% of global trade.
A closure of this route would not only extend shipping times by 10–14 days, as vessels reroute around Africa, but could also push oil prices up by an additional $20 per barrel.
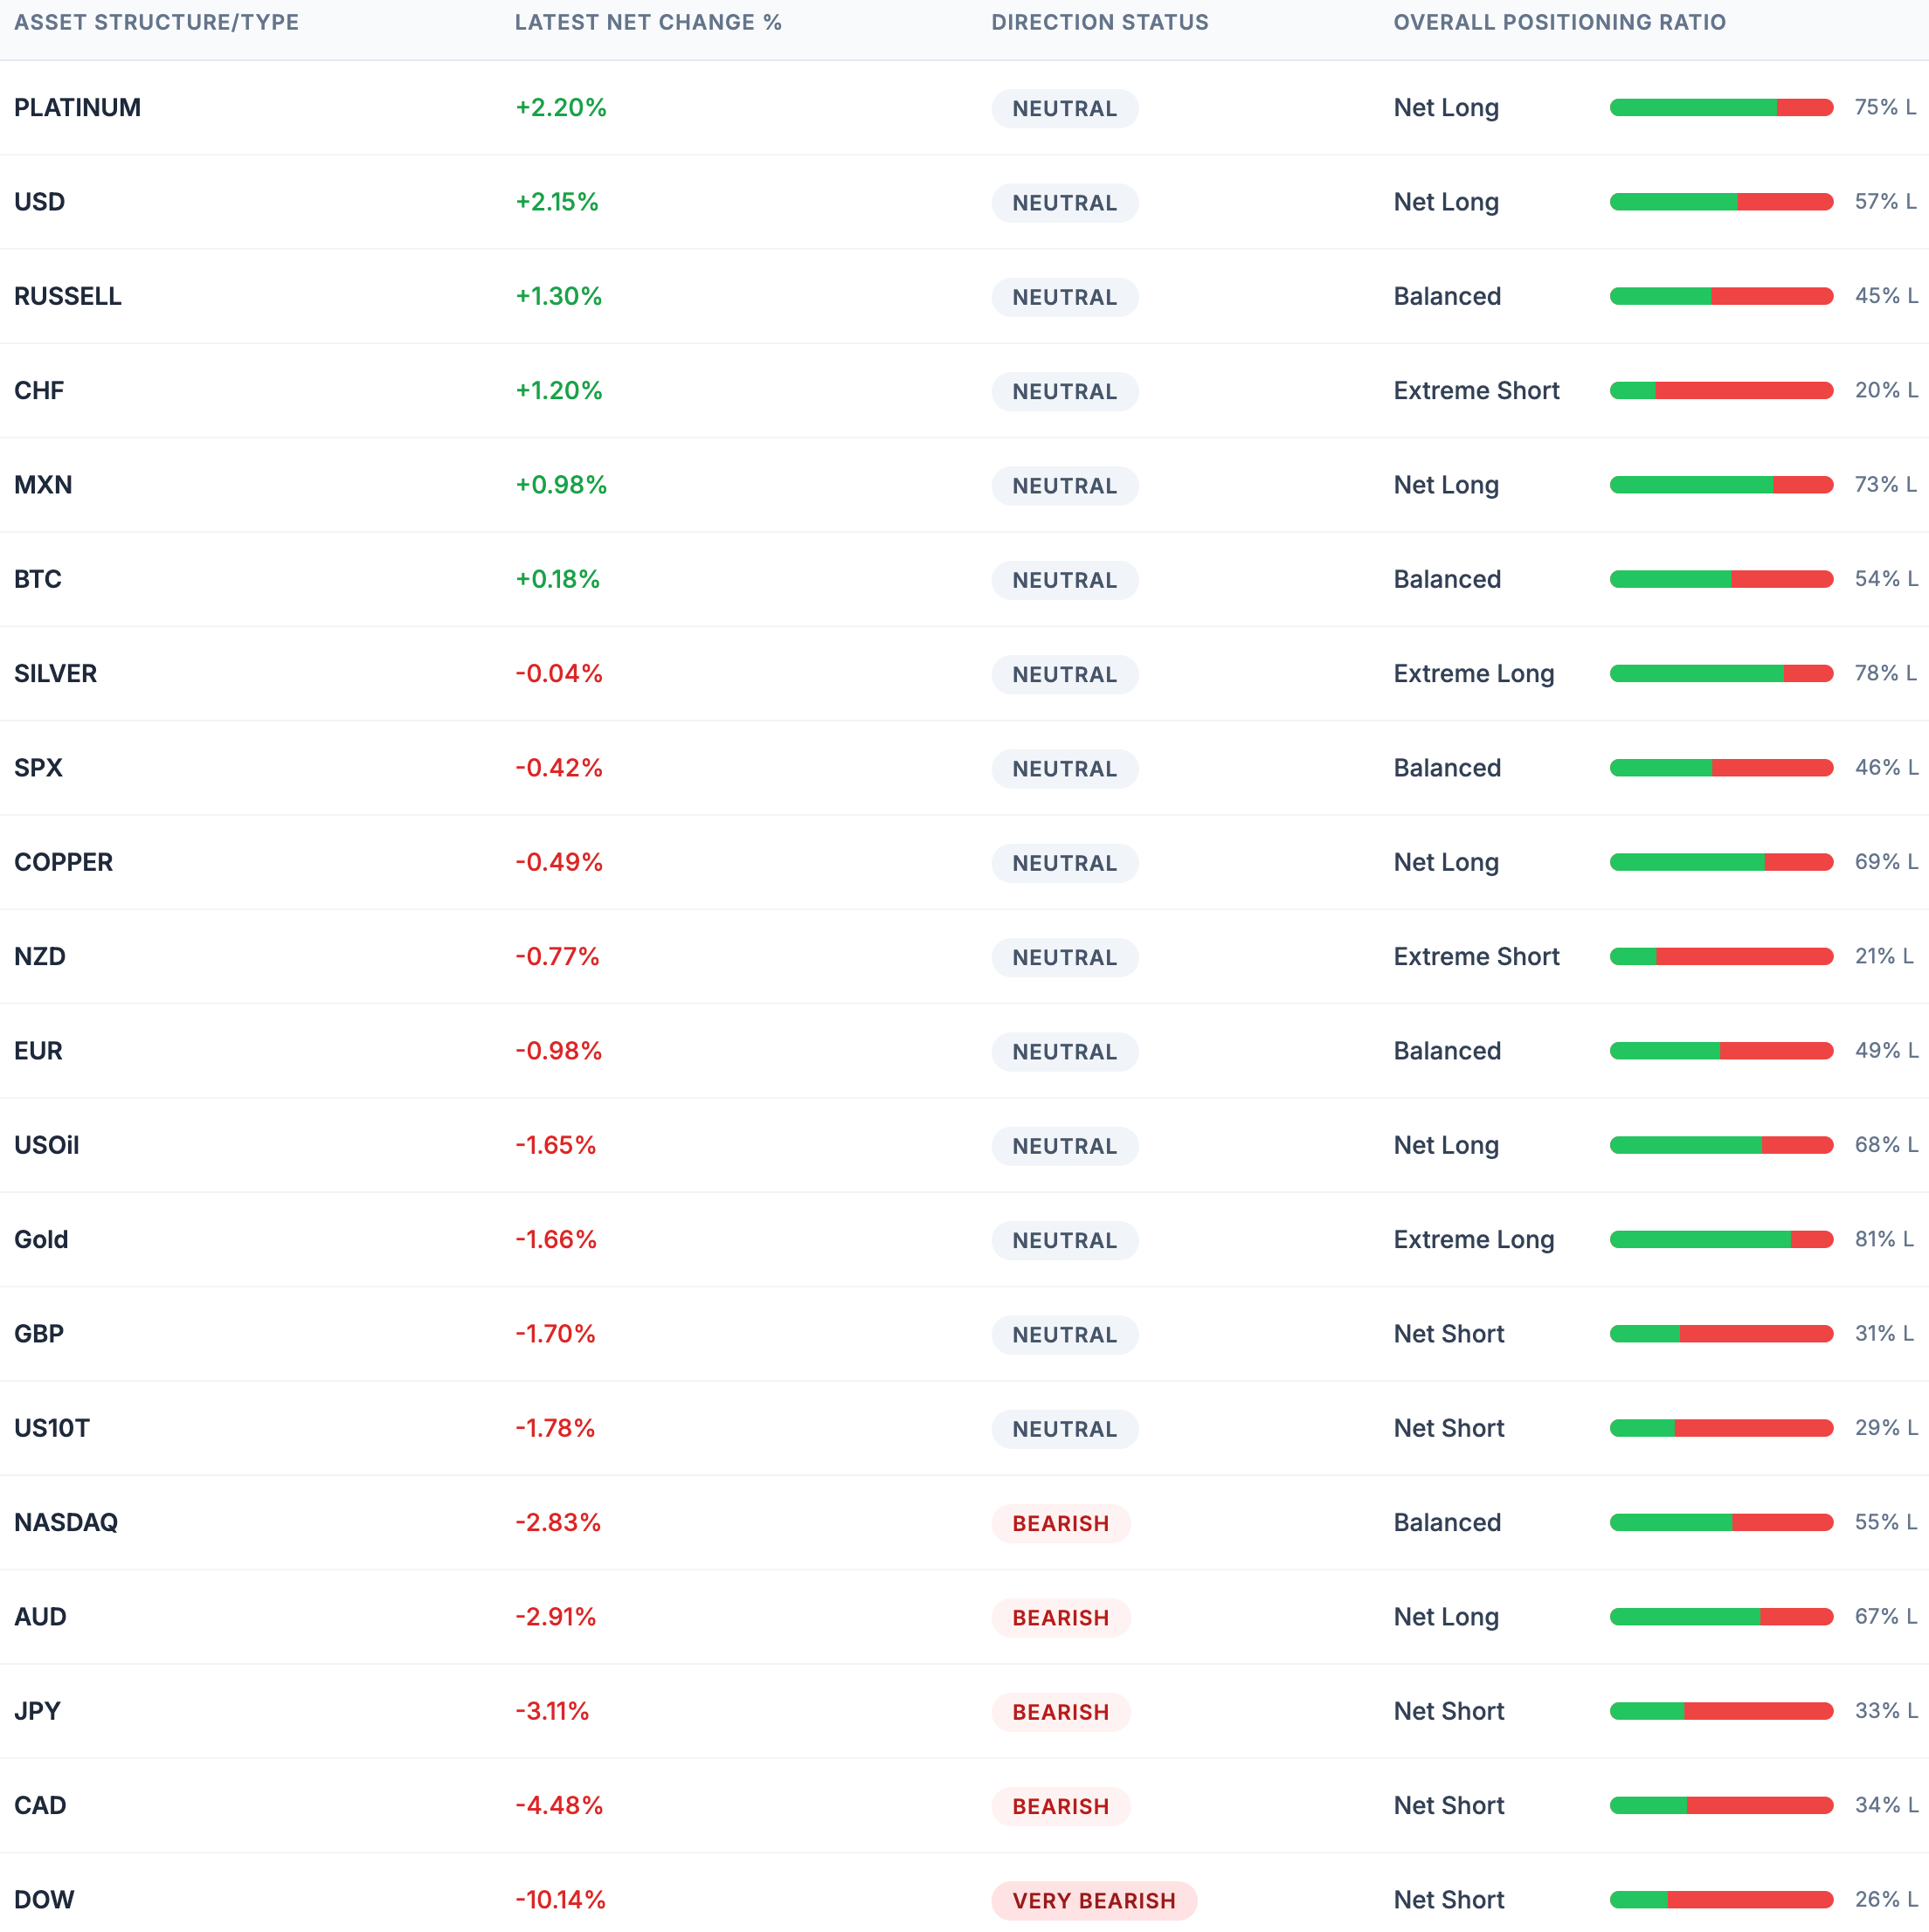
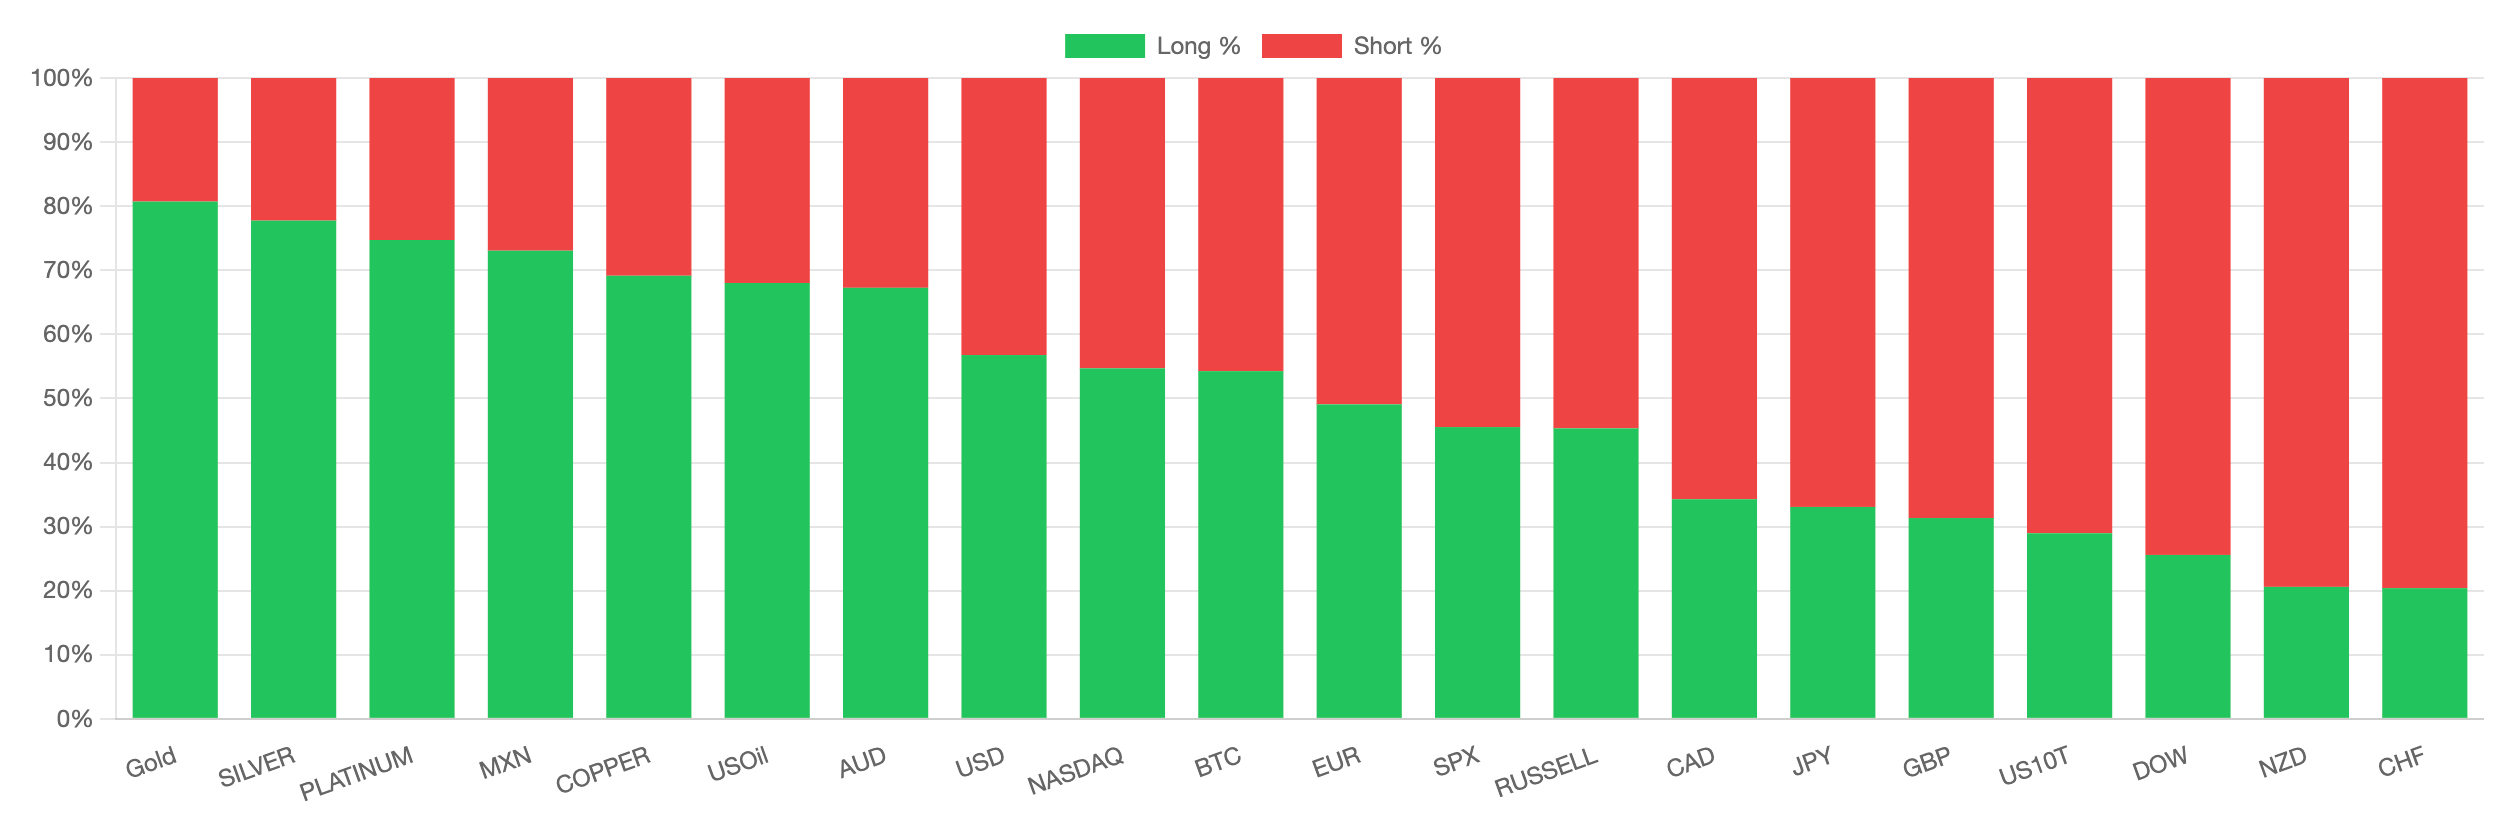
Institutional Positioning
Before turning to this week’s macroeconomic data, below is an overview of recent positioning shifts across major asset classes, based on our proprietary Gauch Research COT Visualizer.
ISM Services PMI (Previous: 56.1, Forecast: 54.8, Actual: 54.0)
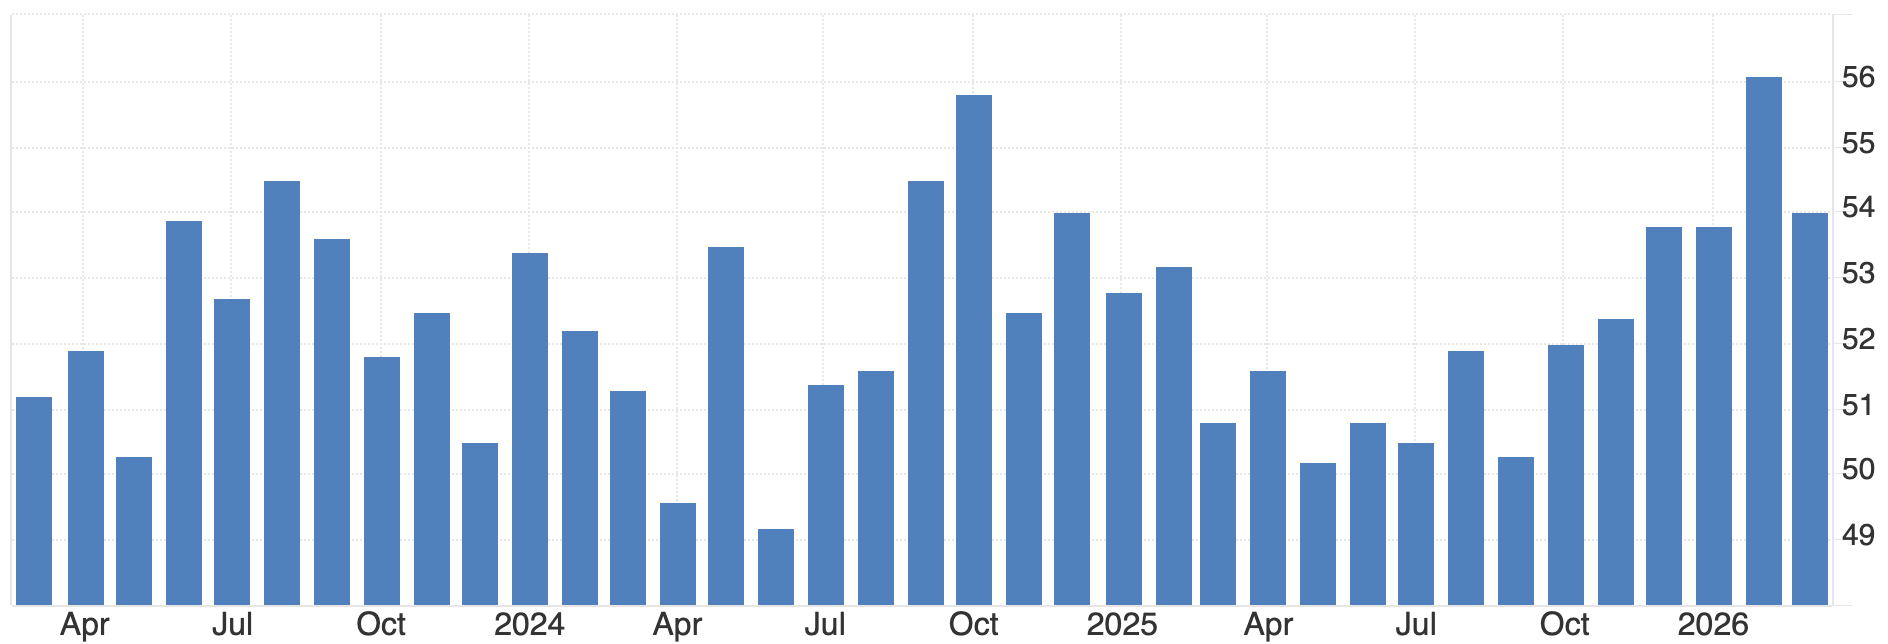
The Institute for Supply Management (ISM) Services Purchasing Managers’ Index declined to 54.0 in March 2026, down from 56.1 in February and below expectations of 55.0.
While the index remains in expansionary territory, the decline signals a moderation in services sector momentum following the strongest reading since August 2022.
The slowdown was primarily driven by a sharp pullback in business activity, which fell to 53.9 from 59.9, and a contraction in employment, which declined to 45.2 from 51.8, marking the first drop in four months.
At the same time, inflationary pressures intensified, with the prices paid index rising to 70.7, the highest level since October 2022, largely reflecting higher energy and fuel costs. Supplier deliveries also slowed, indicating renewed supply chain frictions linked to geopolitical disruptions and adverse weather conditions.
Core PCE Price Index m/m (Previous: 0.4%, Forecast: 0.4%, Actual: 0.4%)
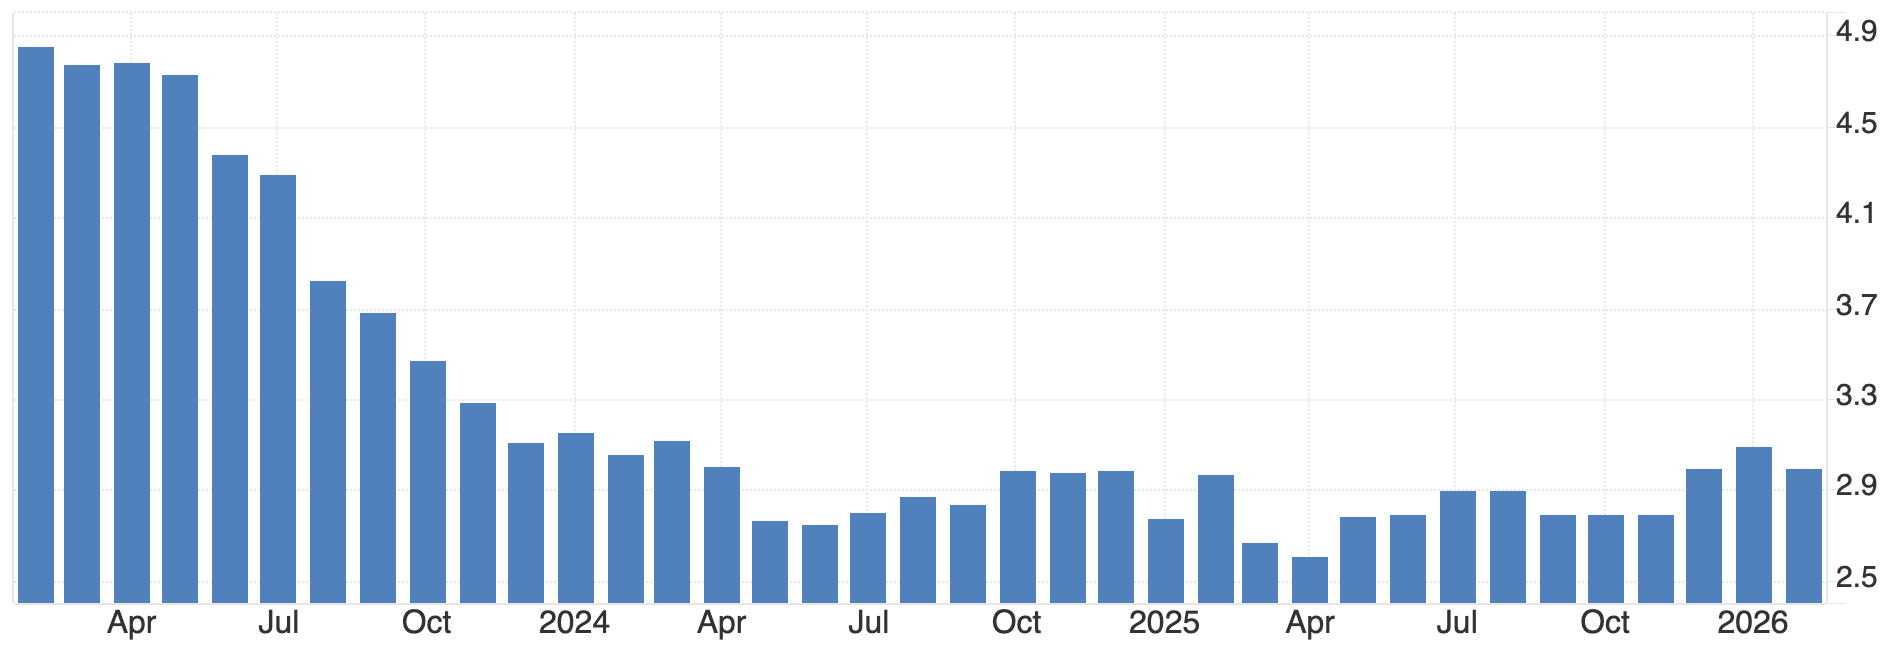
The Core Personal Consumption Expenditures (PCE) Price Index, the preferred inflation gauge of the Federal Reserve, increased by 0.4% month over month in February 2026, maintaining the elevated pace observed in recent months.
On an annual basis, core PCE rose by 3.0%, slightly down from 3.1% previously, but still well above the Federal Reserve’s 2% target.
The data highlights persistent underlying inflation despite some gradual easing and reinforces the challenge for policymakers in balancing inflation control with slowing economic momentum.
Final GDP q/q (Previous: 0.7%, Forecast: 0.7%, Actual: 0.5%)
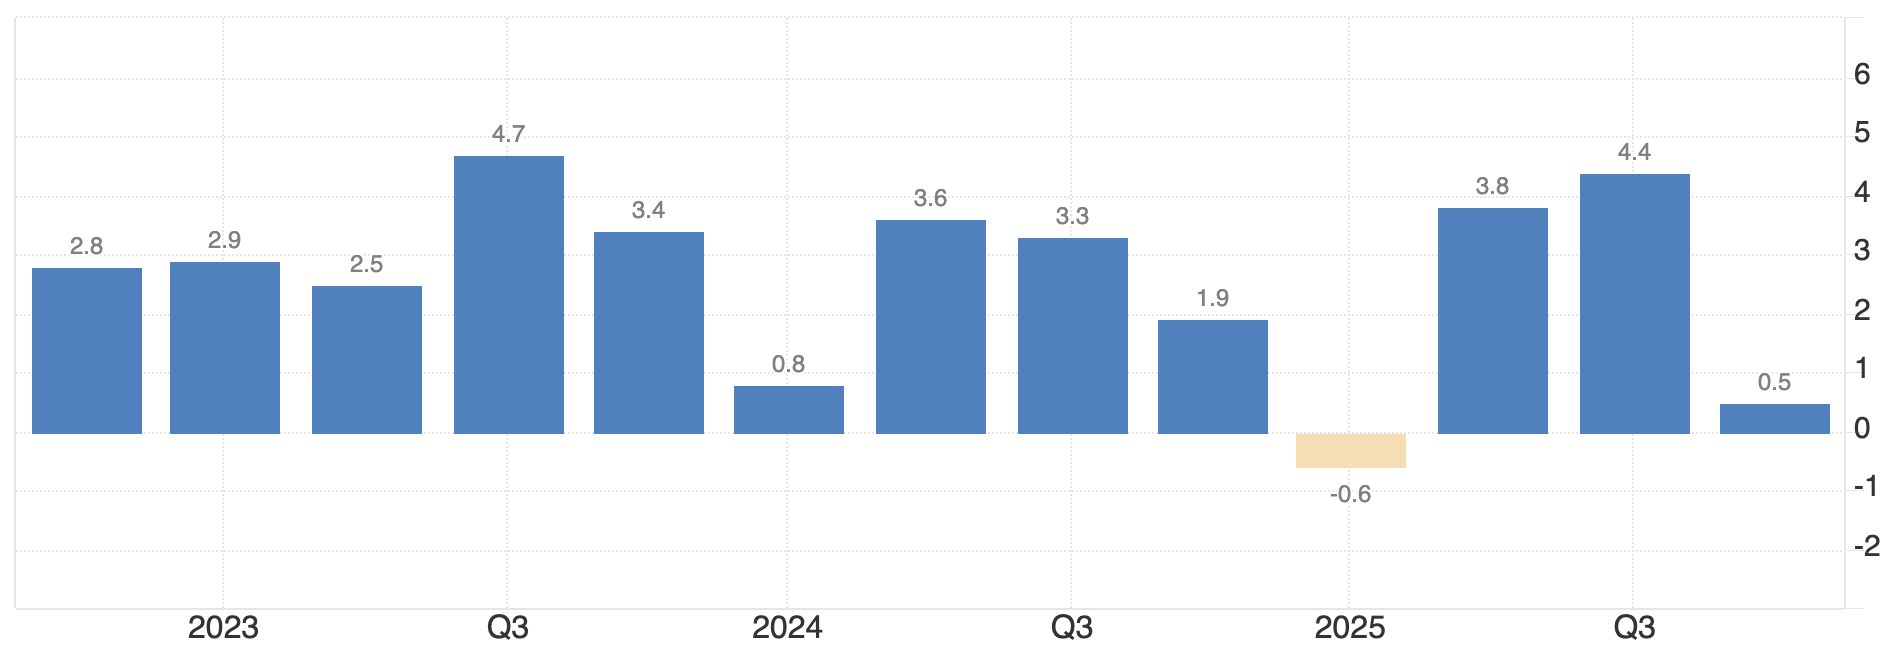
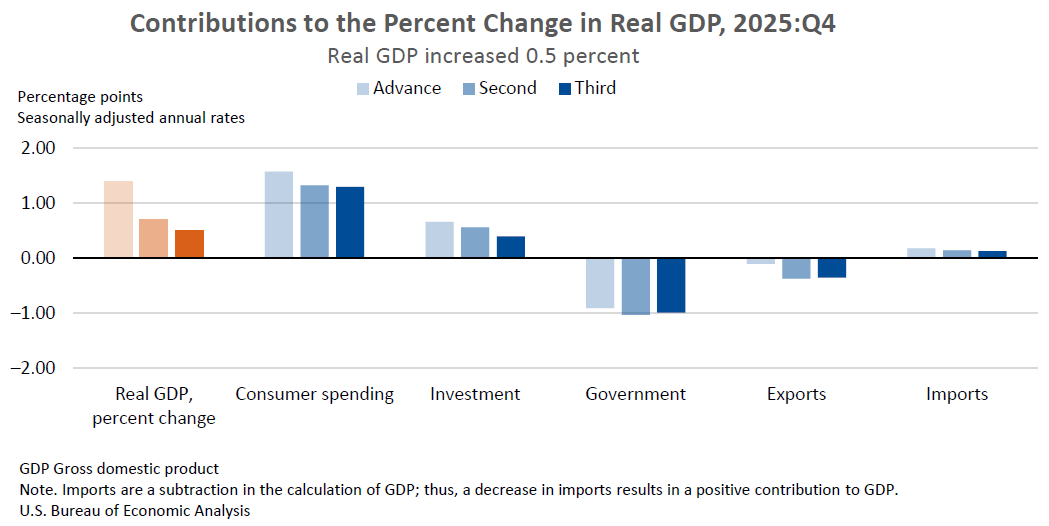
US economic growth was revised lower to an annualized rate of 0.5% for Q4 2025, down from the prior estimate of 0.7% and the initial reading of 1.4%.
The downward revision was primarily driven by weaker investment activity, particularly in structures, which declined sharply. Consumer spending also softened more than expected, reflecting slower growth in both goods and services consumption.
Residential investment contracted further, while exports posted their largest decline since the second quarter of 2023. Government spending saw a significant contraction due to the government shutdown, subtracting nearly one percentage point from overall growth.
Despite the weak fourth quarter, the US economy expanded by 2.1% for the full year 2025.
US CPI m/m (Previous: 0.3%, Forecast: 1.0%, Actual: 0.9%)
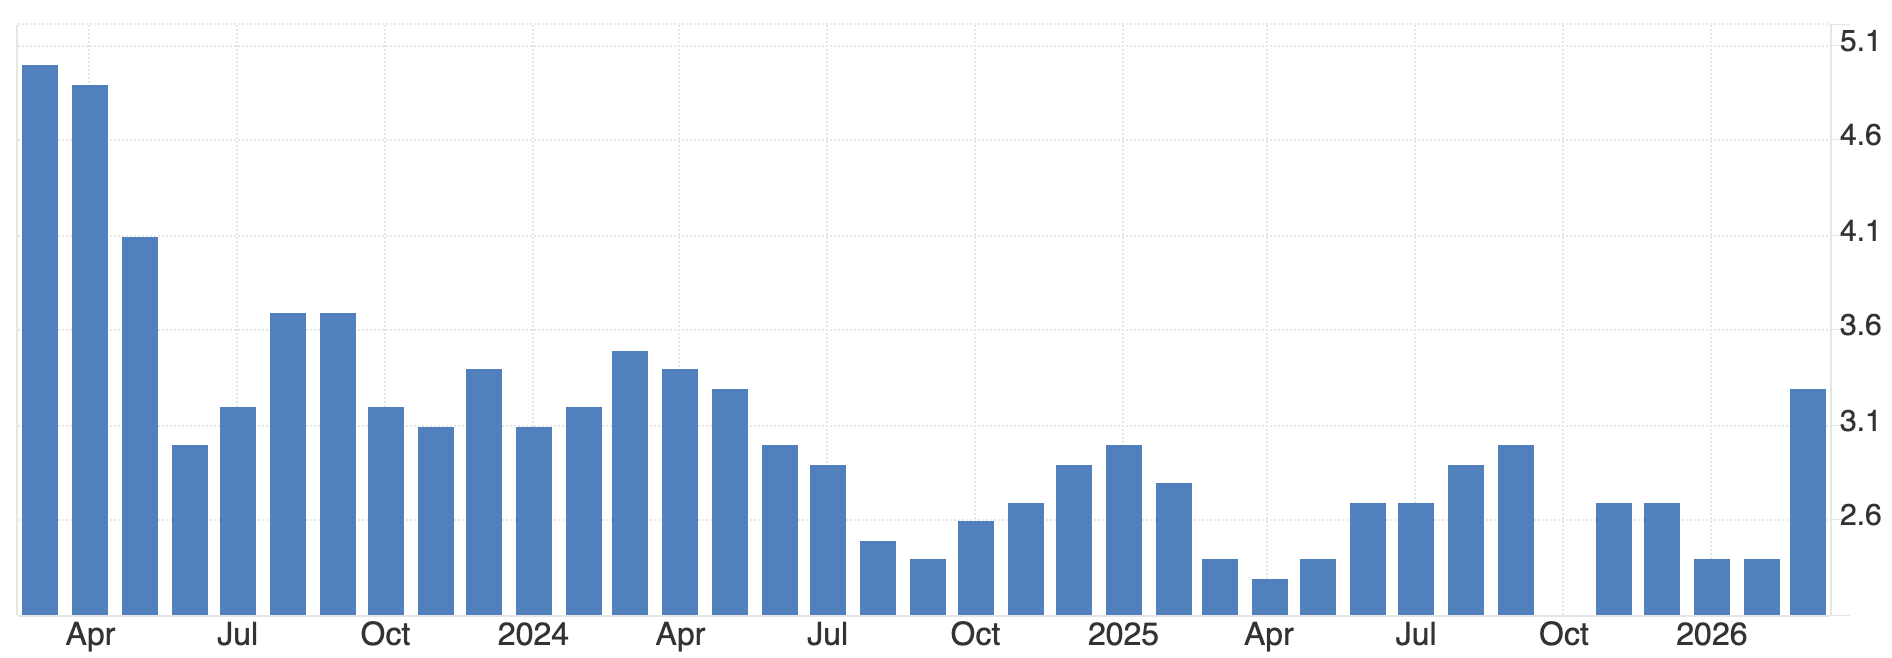
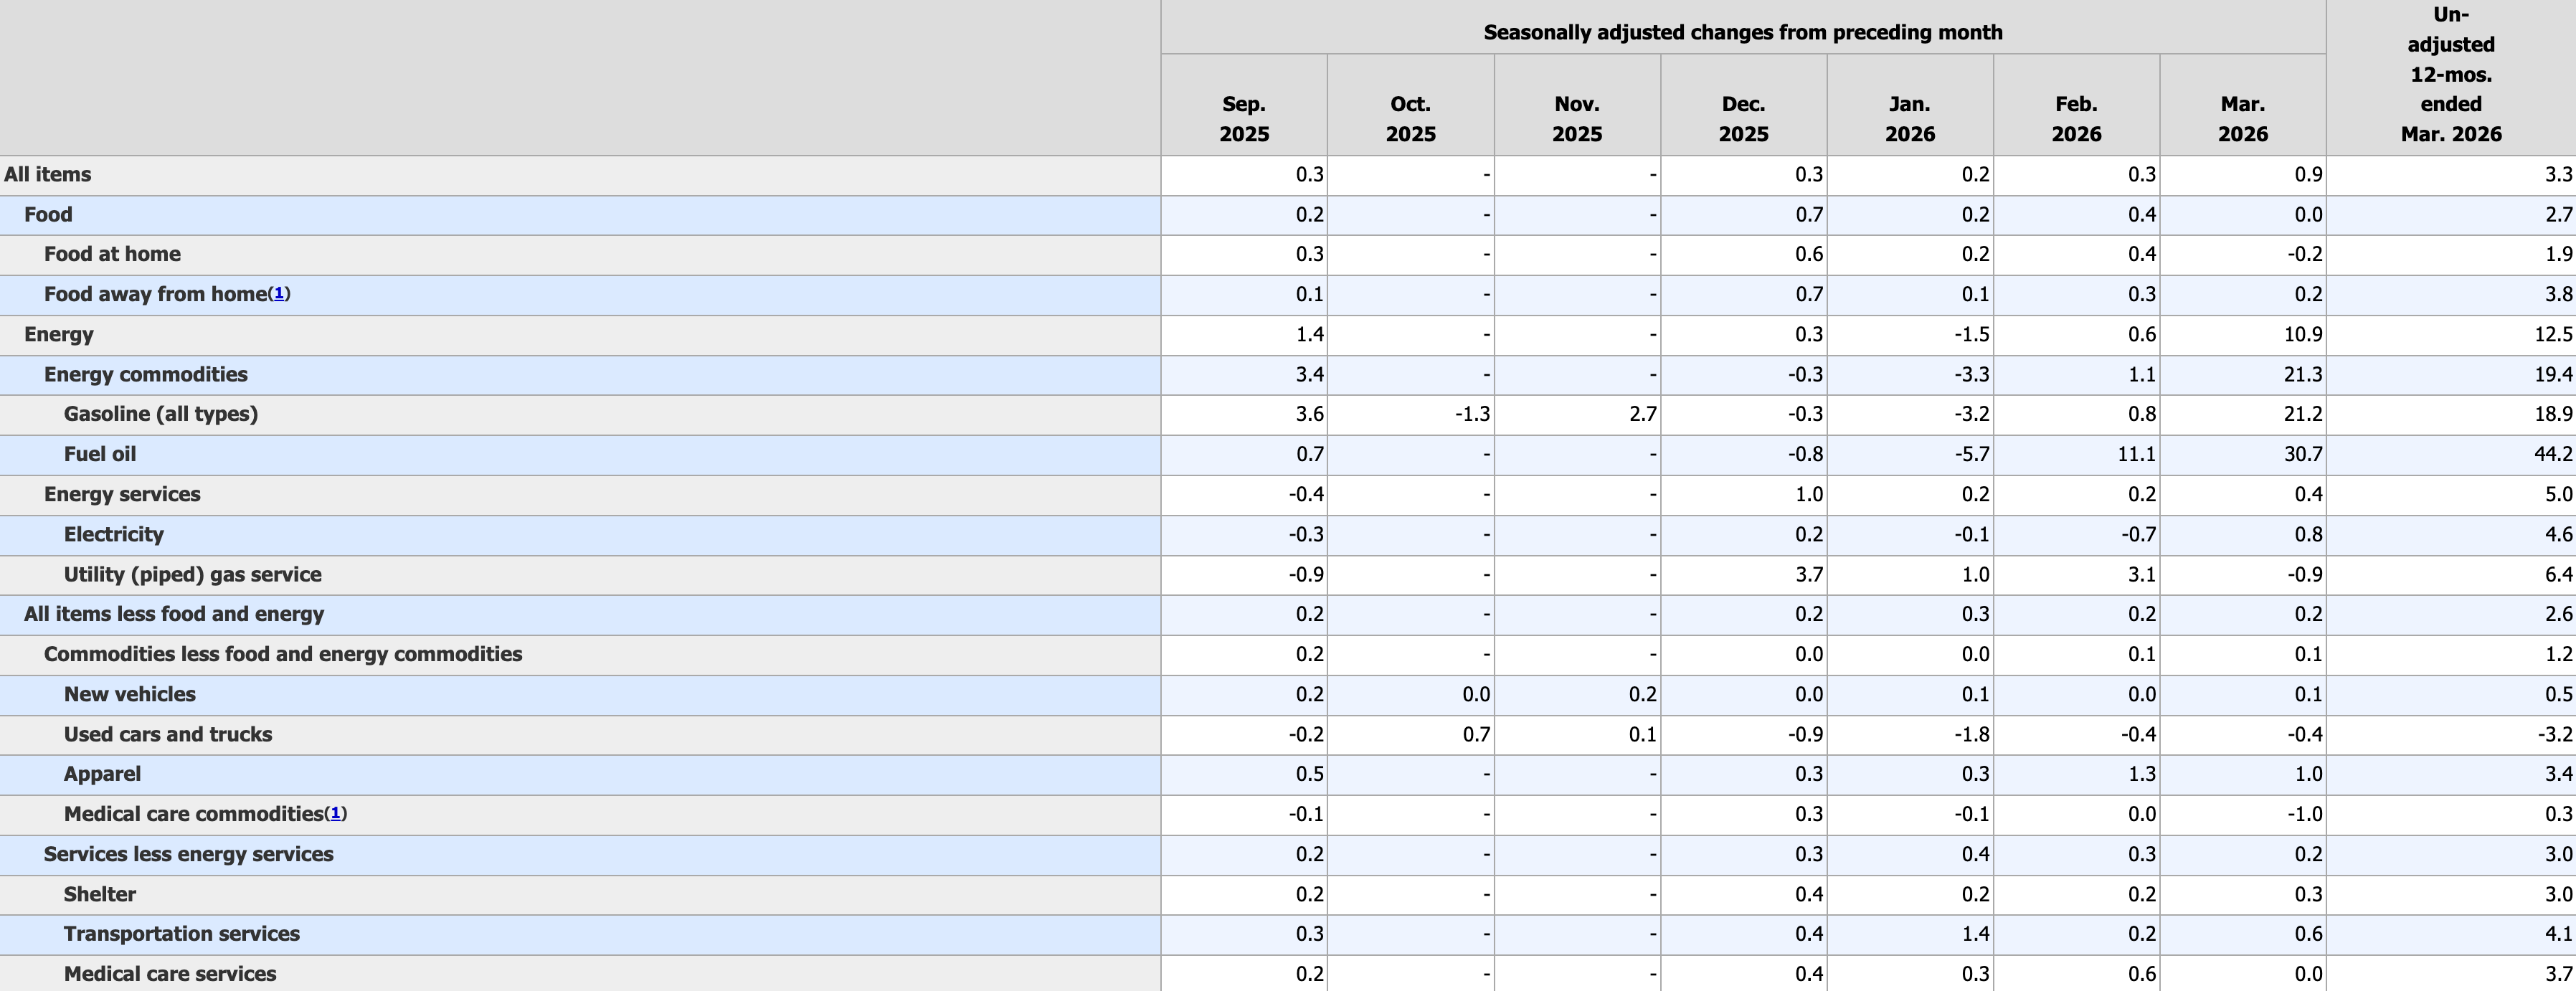
US headline inflation accelerated to 3.3% year over year in March 2026, marking the highest level since May 2024 and a sharp increase from 2.4% in the previous two months. The increase was primarily driven by energy prices, with gasoline and fuel oil rising significantly amid escalating geopolitical tensions involving Iran.
On a monthly basis, CPI rose by 0.9%, the strongest increase since June 2022, largely due to a surge in fuel costs.
In contrast, core inflation remained more contained. Core CPI rose by 0.2% month over month and 2.6% year over year, indicating that underlying inflationary pressures, while still elevated, are not accelerating at the same pace as headline figures.
This Print eases immediate pressure on the Fed to adjust rates, supporting the view that policy will remain higher for longer, particularly as energy-driven inflation can be framed as transitory.
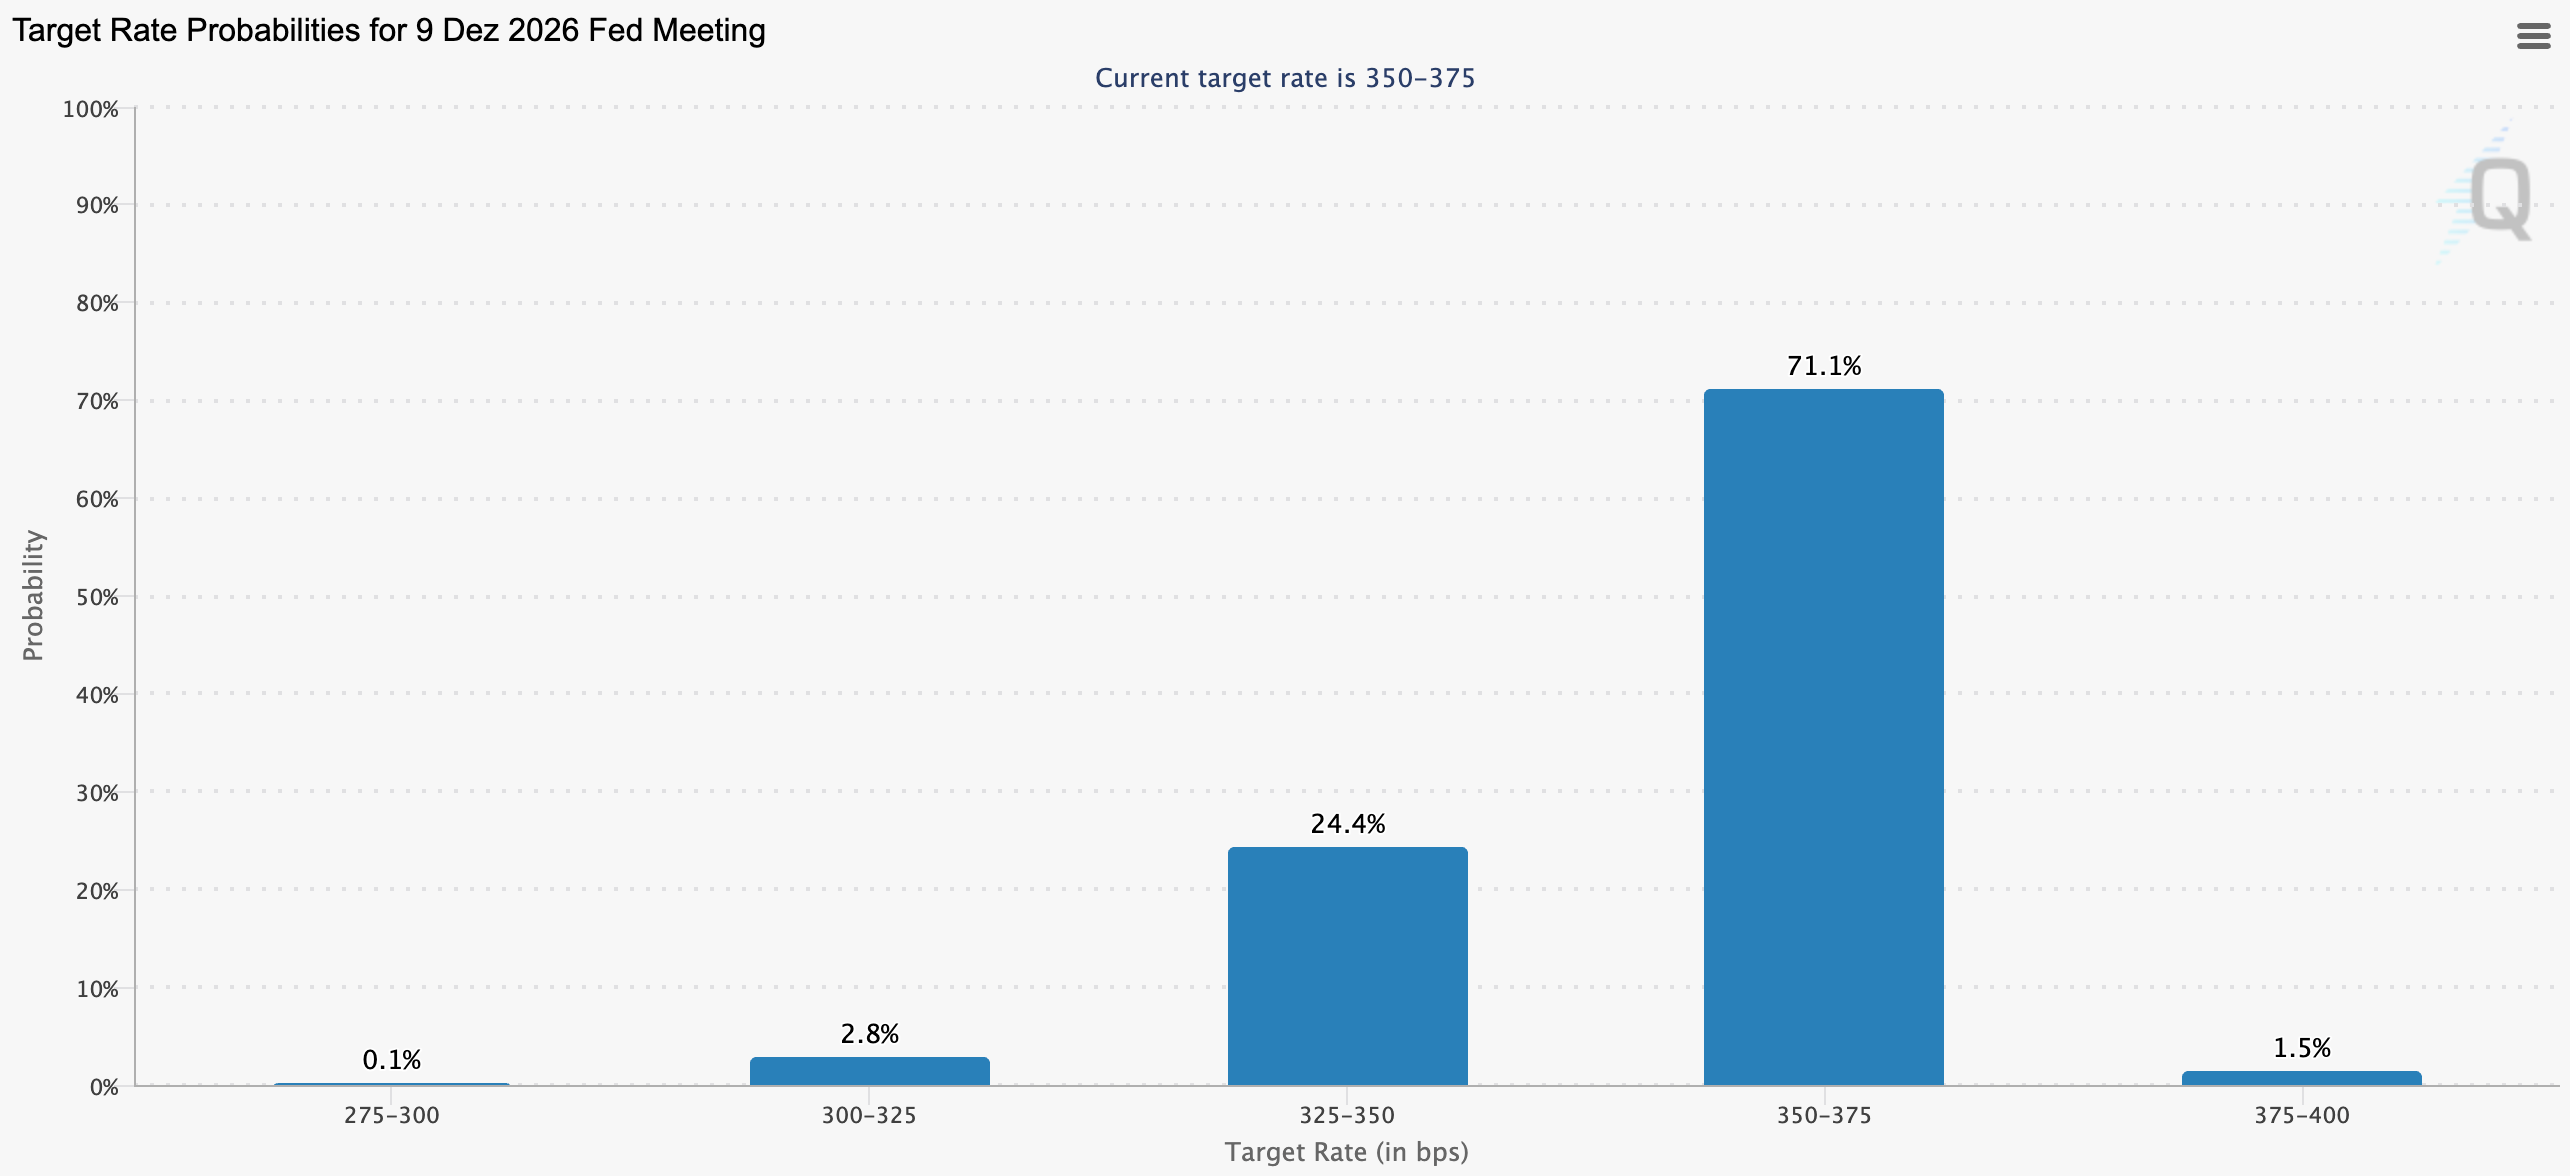
For now, the target rate is expected to remain in the 350–375 bps range throughout the year.
Upcoming News
US PPI
Wishing you a successful trading week ahead,
David Gauch
Founder, Gauch Research
COT data is released on Friday, but it only reflects positions up to Tuesday, so we’ll have to wait for the next report to see if they covered any over the weekend.
If not, it would have been an expensive lesson in betting solely on the hope of a potential easing of the conflict.
thought indices would have seen short covering by institutions? guess not