
SVC-Update
Weekly Recap & Outlook

No financial advice.
Last week gave us a clearer read on the current macro backdrop. The two key data points were, without question, NFP and CPI, and they came in surprisingly mixed. We saw strength on the labor side while inflation cooled, creating a conflicting signal for markets.
As a result, price action reflected that uncertainty. The DXY spent most of the week in consolidation, and the S&P 500 continued to trade within the same range between the previously discussed gamma exposure levels. Notably, the index is still struggling to break through the 7,000 gamma zone.
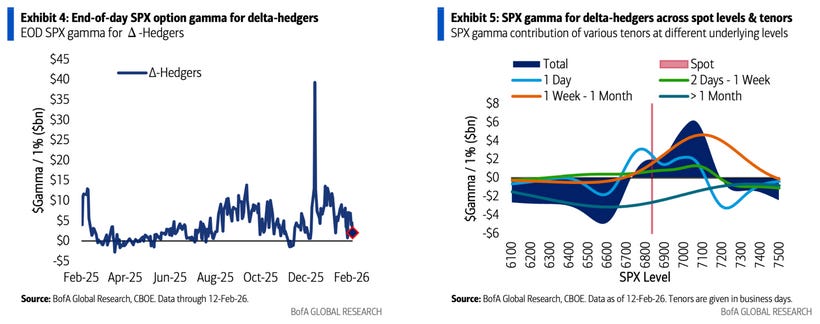
What this tells us is that options dealers are heavily hedged around that area. Their positioning forces them to trade counter-cyclically, which repeatedly pushes the market back into the range whenever it tries to break out. That said, there is some reason for cautious optimism over the coming weeks, this gamma wall could gradually fade. In fact, part of that pressure may already have started to roll off into Friday.
However, as we move into the second half of February, another potential headwind comes into play, at least according to flow traders like Citadel’s Scott Rubner. Historically, February is not only the second-worst month of the year, but retail flows also tend to slow down significantly during this period. Early data suggests that this drop in participation may already be underway.
“This time is different.”
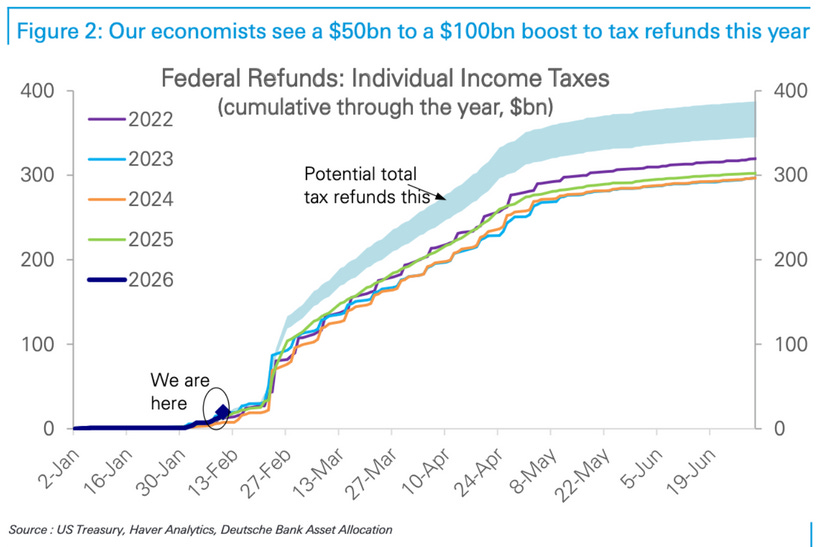
And there is a case to be made that it actually might be. As we know, the current U.S. administration passed what is commonly referred to as the “One Big Beautiful Bill Act” last year. While that is not its official name, the legislation includes substantial tax relief for households. A portion of those refunds could find its way back into the markets.
According to early estimates, the first larger refund waves should start arriving toward the end of February, with total inflows potentially reaching a $50–100 billion delta over the course of the year.
Non-Farm Employment Change (Previous: 48K, Forecast: 66K, Actual: 130K):
January’s labor data came in significantly stronger than expected, adding 130K payrolls, well above both the consensus estimate of 66K and December’s downwardly revised 48K print. It marks the strongest monthly gain since December 2024 and suggests that, at least on the surface, the labor market is still showing pockets of resilience.
Most of the strength came from the services side. Health care led the gains with 82K new jobs, driven primarily by ambulatory health care services, which accounted for 50K of that increase. Social assistance added another 42K, while construction contributed 33K. Manufacturing posted a modest gain of 5K jobs.
On the negative side, the federal government shed 34K jobs, largely due to deferred resignation programs from 2025 rolling off payrolls. Financial activities also declined by 22K. Several major sectors showed little to no change, including mining, wholesale and retail trade, transportation and warehousing, information, professional and business services, and leisure and hospitality.
However, the more important takeaway sits beneath the headline number. Total nonfarm employment growth for 2025 was sharply revised down to +181K from a previously reported +584K. That revision implies an average monthly job gain of just 15K, far below the earlier estimate of 49K.
So while January’s print looks strong in isolation, the broader trend points to a much softer labor market than previously believed. This keeps the macro picture mixed, short-term resilience in the data, but a noticeably weaker underlying employment trajectory.
CPI y/y (Previous: 2.7%, Forecast: 2.5%, Actual: 2.4%):
Inflation data for January reinforced the cooling trend, with the annual CPI rate slowing to 2.4%, its lowest level since May. That marks a decline from 2.7% in both of the previous two months and came in slightly below the 2.5% consensus forecast.
A large part of the deceleration was driven by base effects, as higher readings from a year ago rolled out of the annual calculation. The most notable relief came from the energy complex. Overall energy prices declined by 0.1% after rising 2.3% in December, led by sharp drops in gasoline and fuel oil. Natural gas prices continued to rise, but at a slightly slower pace than the month before.
Outside of energy, there were also pockets of easing. Used car and truck prices moved back into negative territory, while inflation in food and shelter moderated slightly. These components remain important, but the incremental slowdown suggests that some of the stickier price pressures are gradually softening.
On a monthly basis, headline CPI increased by 0.2%, down from 0.3% in December and below expectations. Core inflation also edged lower, with the annual rate falling to 2.5%, its lowest reading since March 2021 and in line with forecasts. However, the monthly core print came in at 0.3%, a touch firmer than December’s 0.2%, indicating that underlying price pressures have not fully disappeared.
Overall, the report points to continued disinflation, but not a clean, linear path lower. Headline trends are improving, largely helped by energy and base effects, while core dynamics still show some persistence beneath the surface.
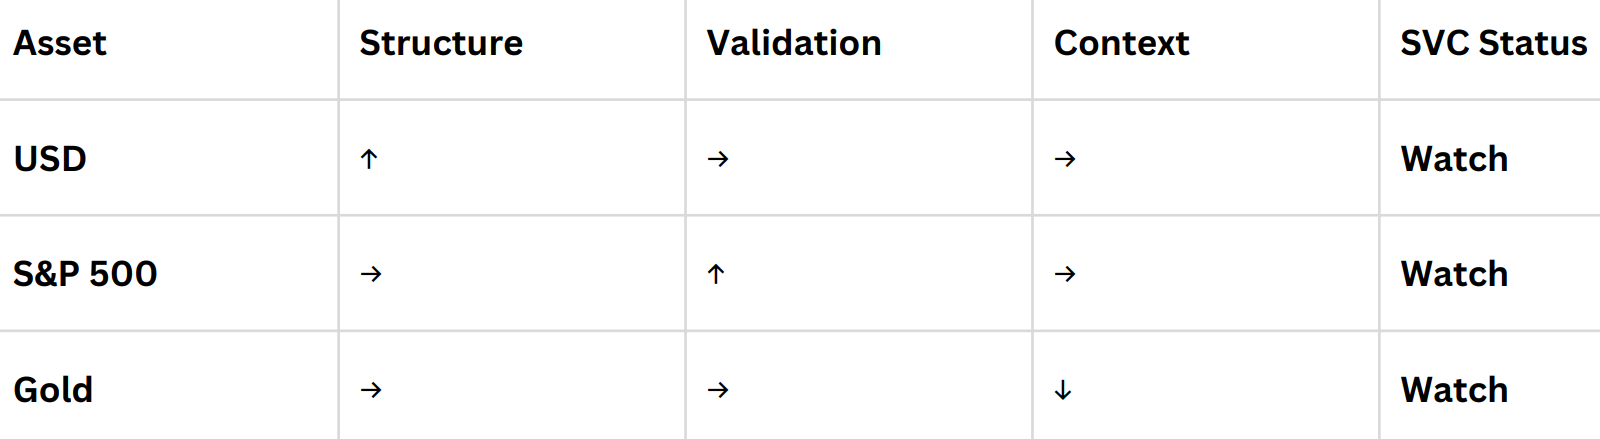
SVC Breakdown
USD
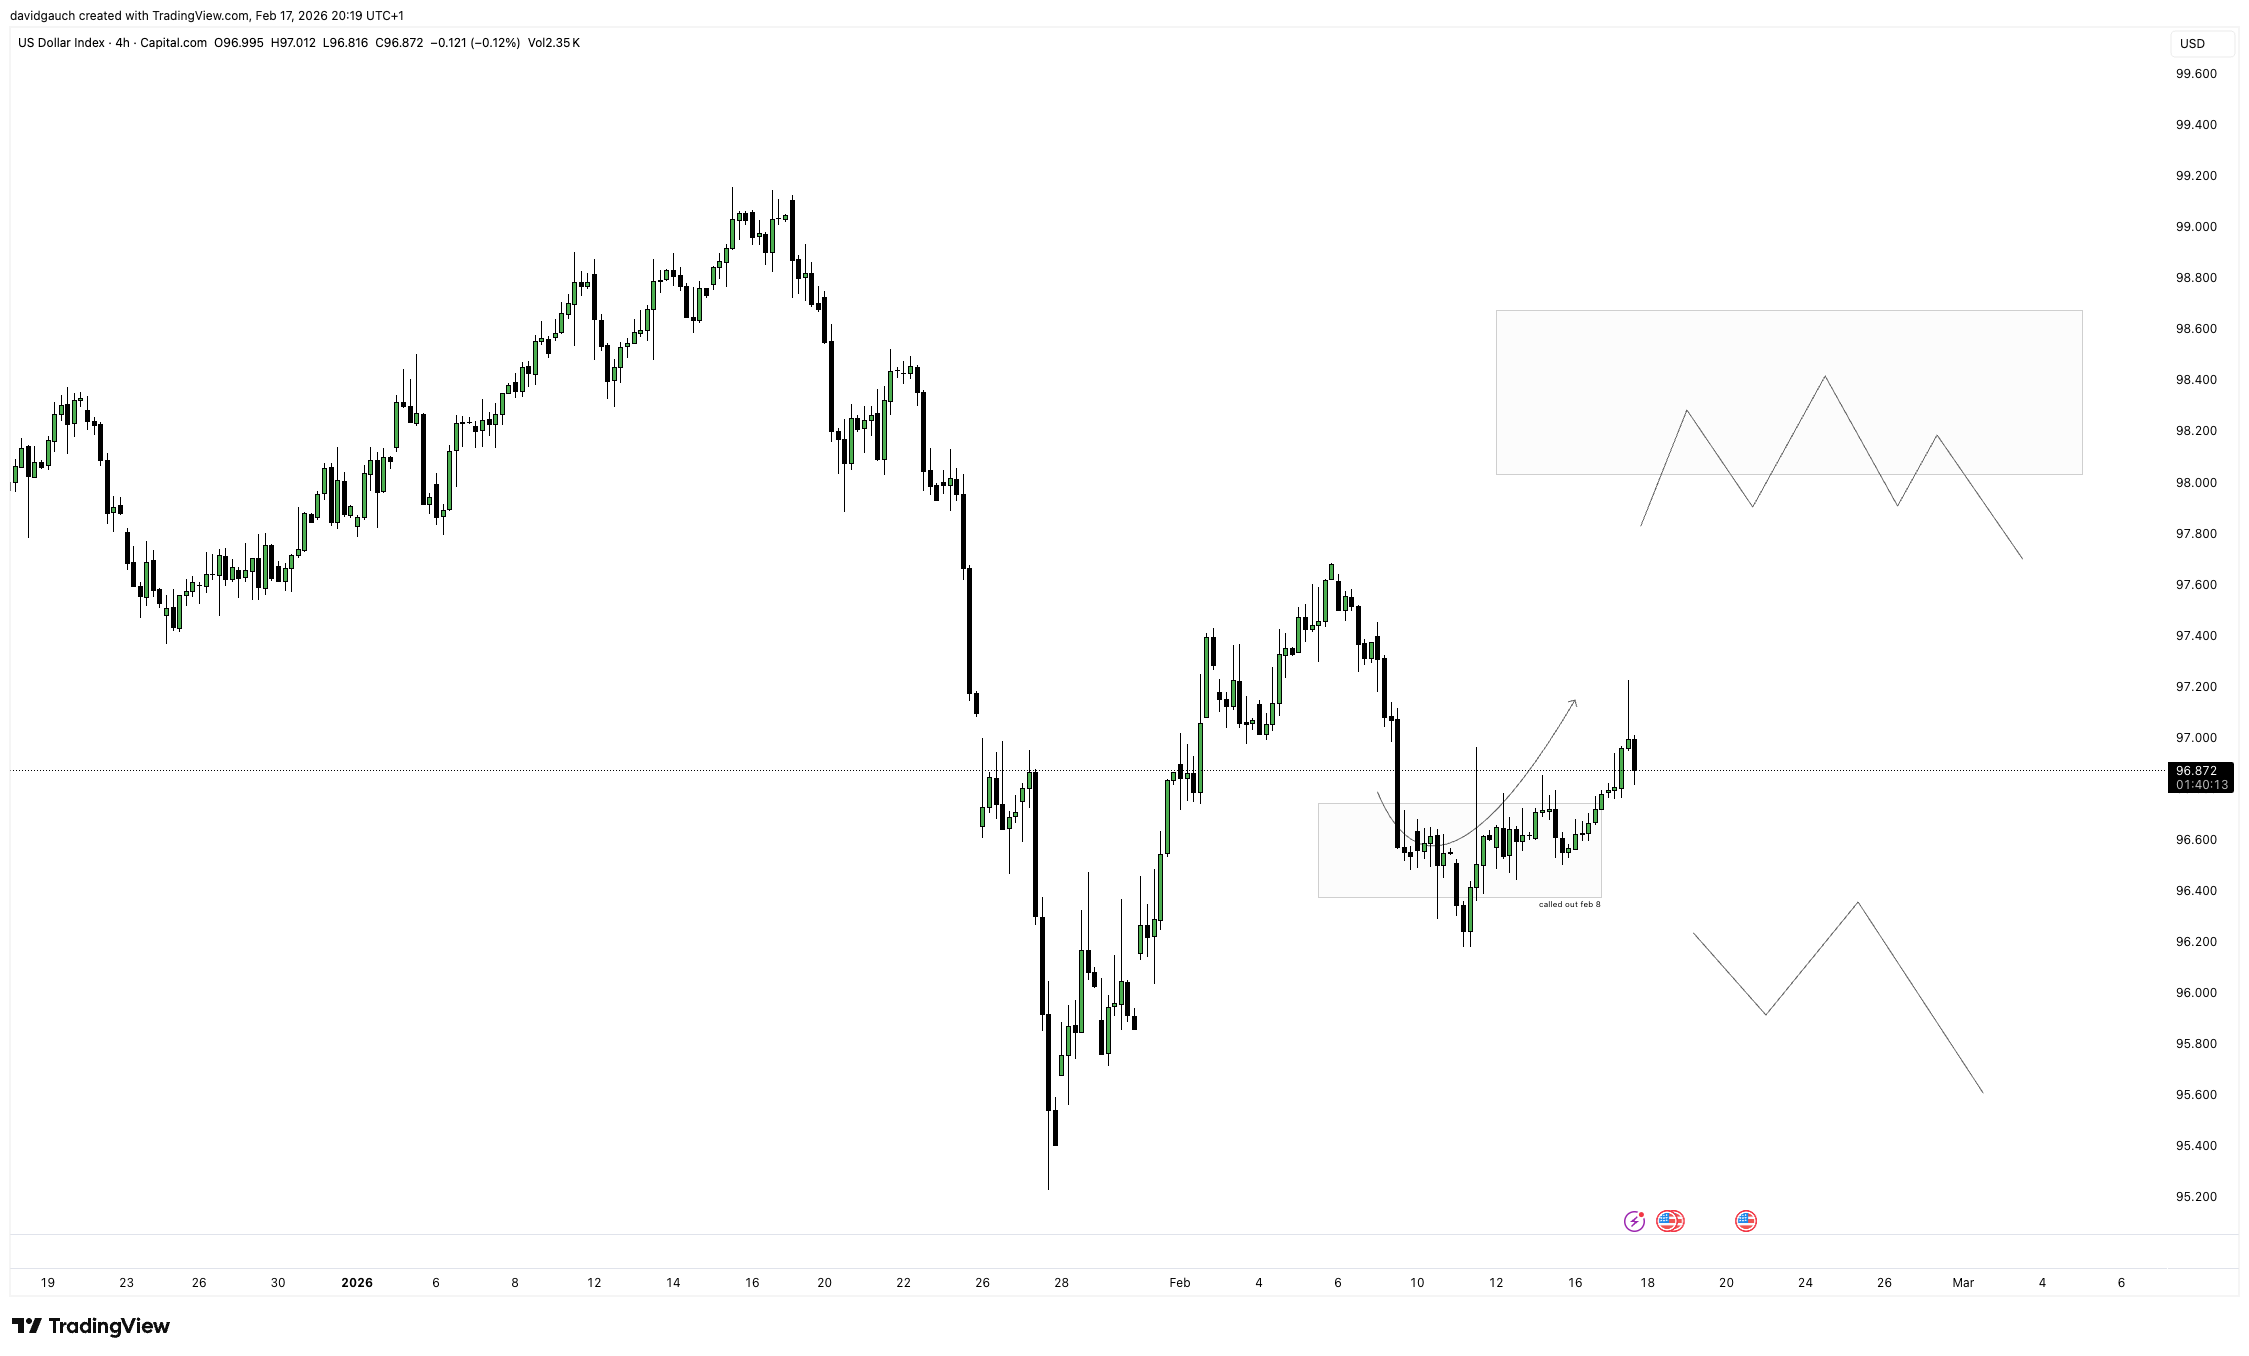
Even though last week’s data gave us additional insight into the current state of the economy, price action remains trapped within the same overall range.
The zone discussed in the last SVC update offered solid opportunities for short-term long setups, as anticipated. Price reacted cleanly and respected the structure.
From here, the key level to watch is that same area to the downside. If it breaks decisively, the bias shifts. A sustained move below that zone would invalidate the short-term bullish structure and increase the probability of momentum to the downside, at which point I would start prioritizing short setups again.
For now, we remain range-bound. The playbook stays tactical, not directional.
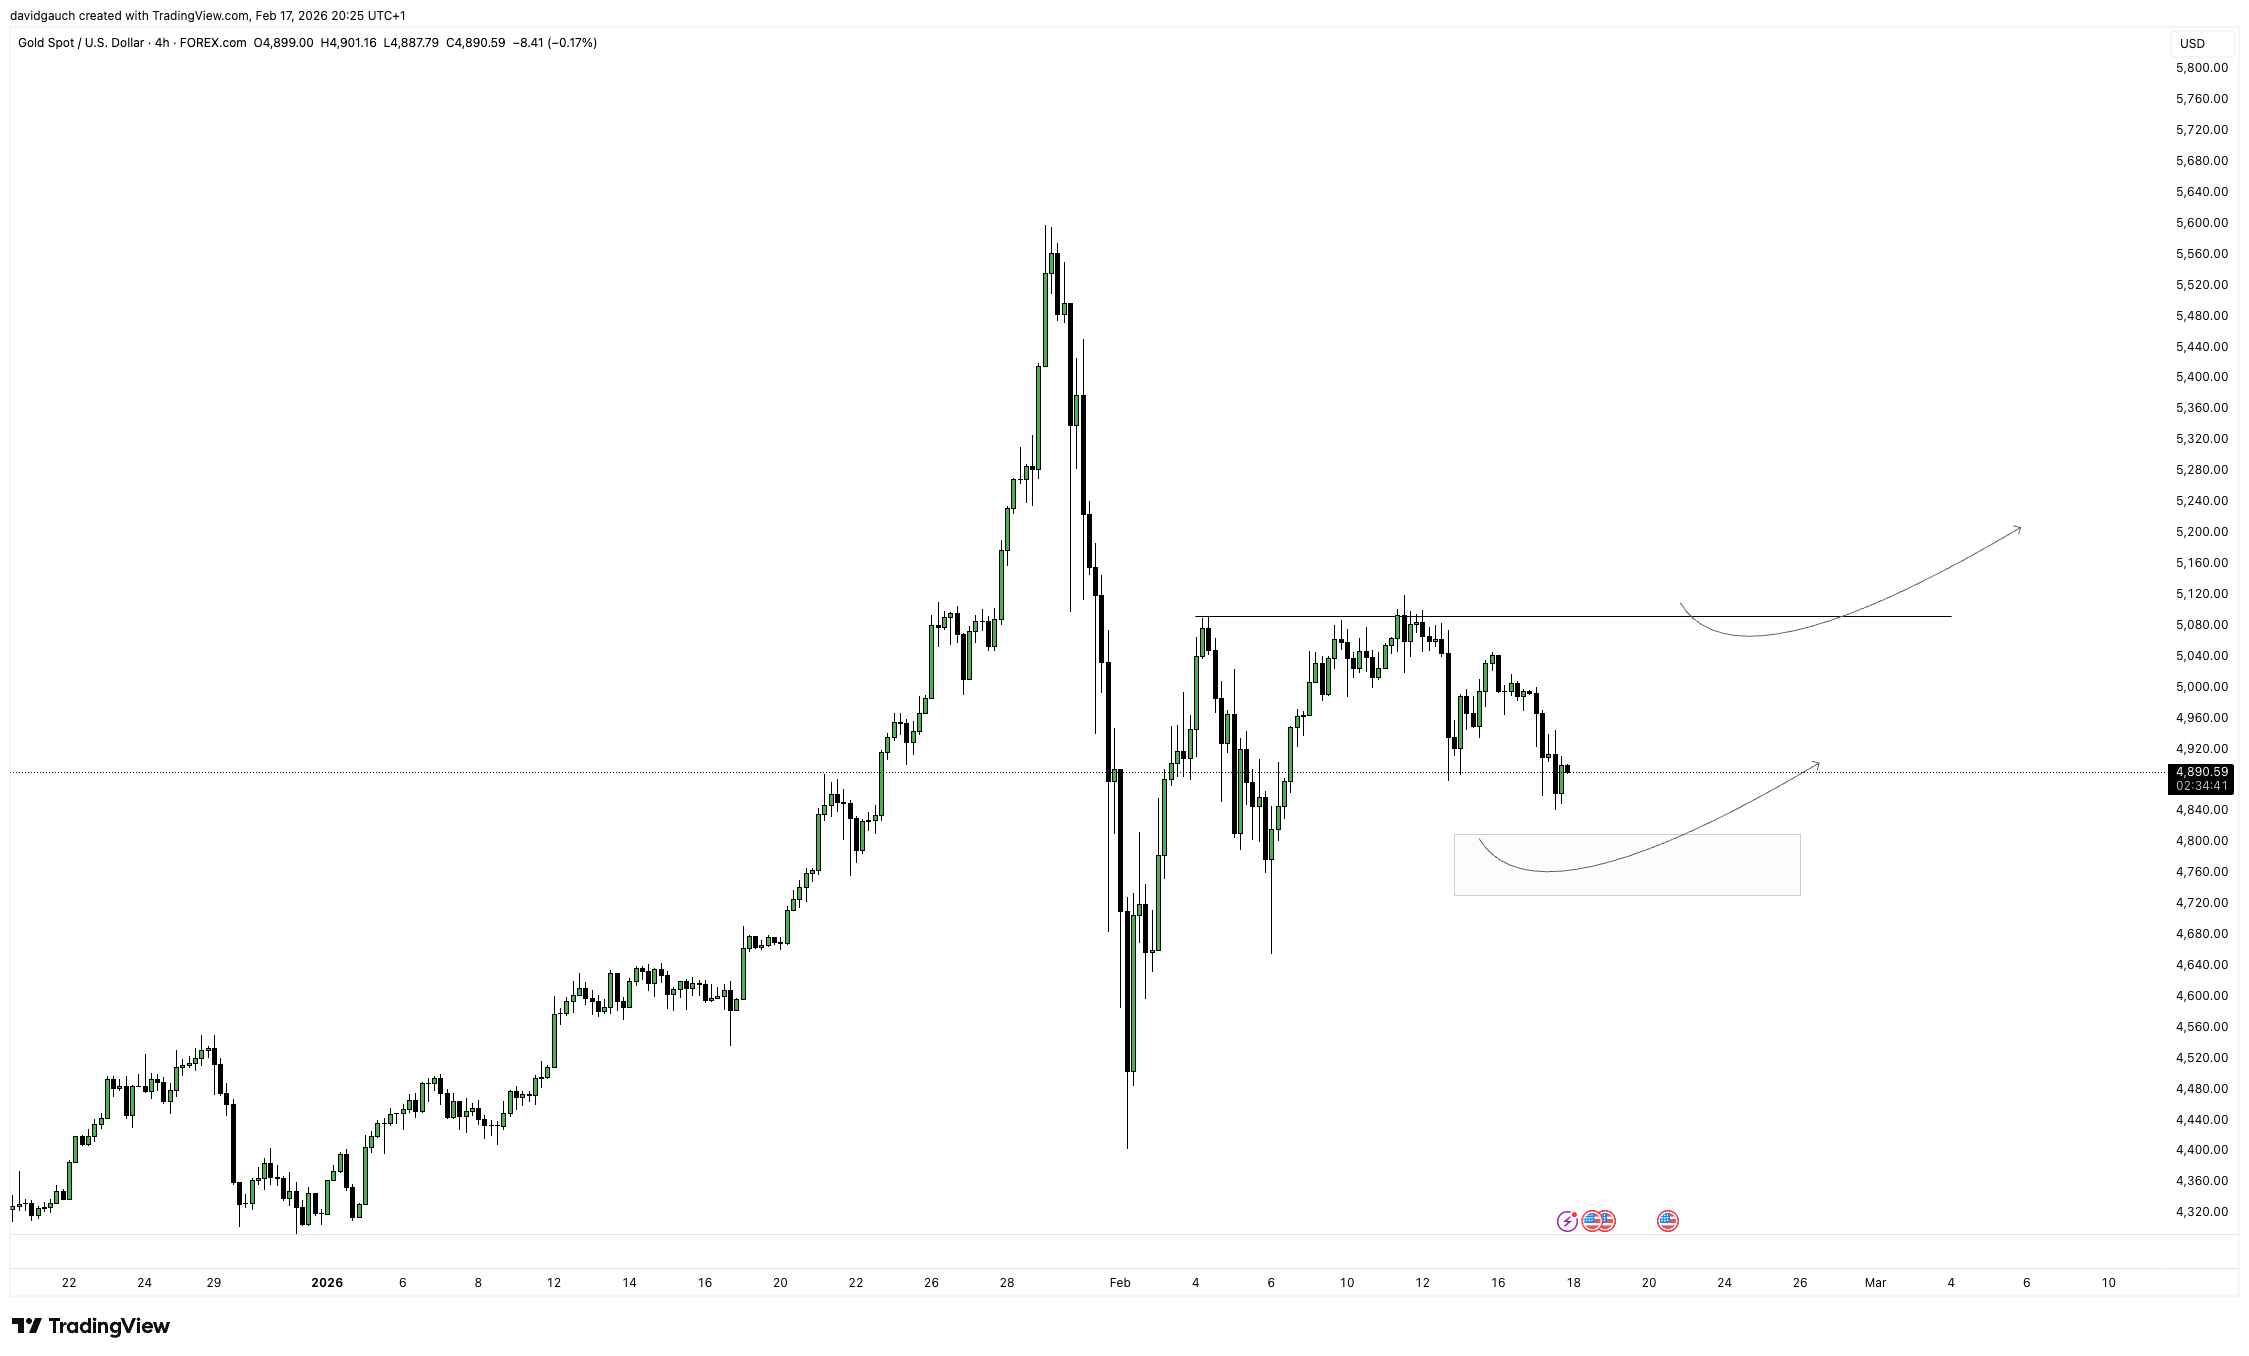
Gold
A very similar setup is unfolding in gold. Here as well, price has mostly offered opportunities within the same range that has been highlighted in the last few updates.
The market continues to respect those boundaries, meaning the best trades have come from tactical entries inside the range rather than trying to anticipate a breakout. Until we see a clear expansion beyond those levels, the environment remains more suited for short-term, range-based setups rather than strong directional plays.
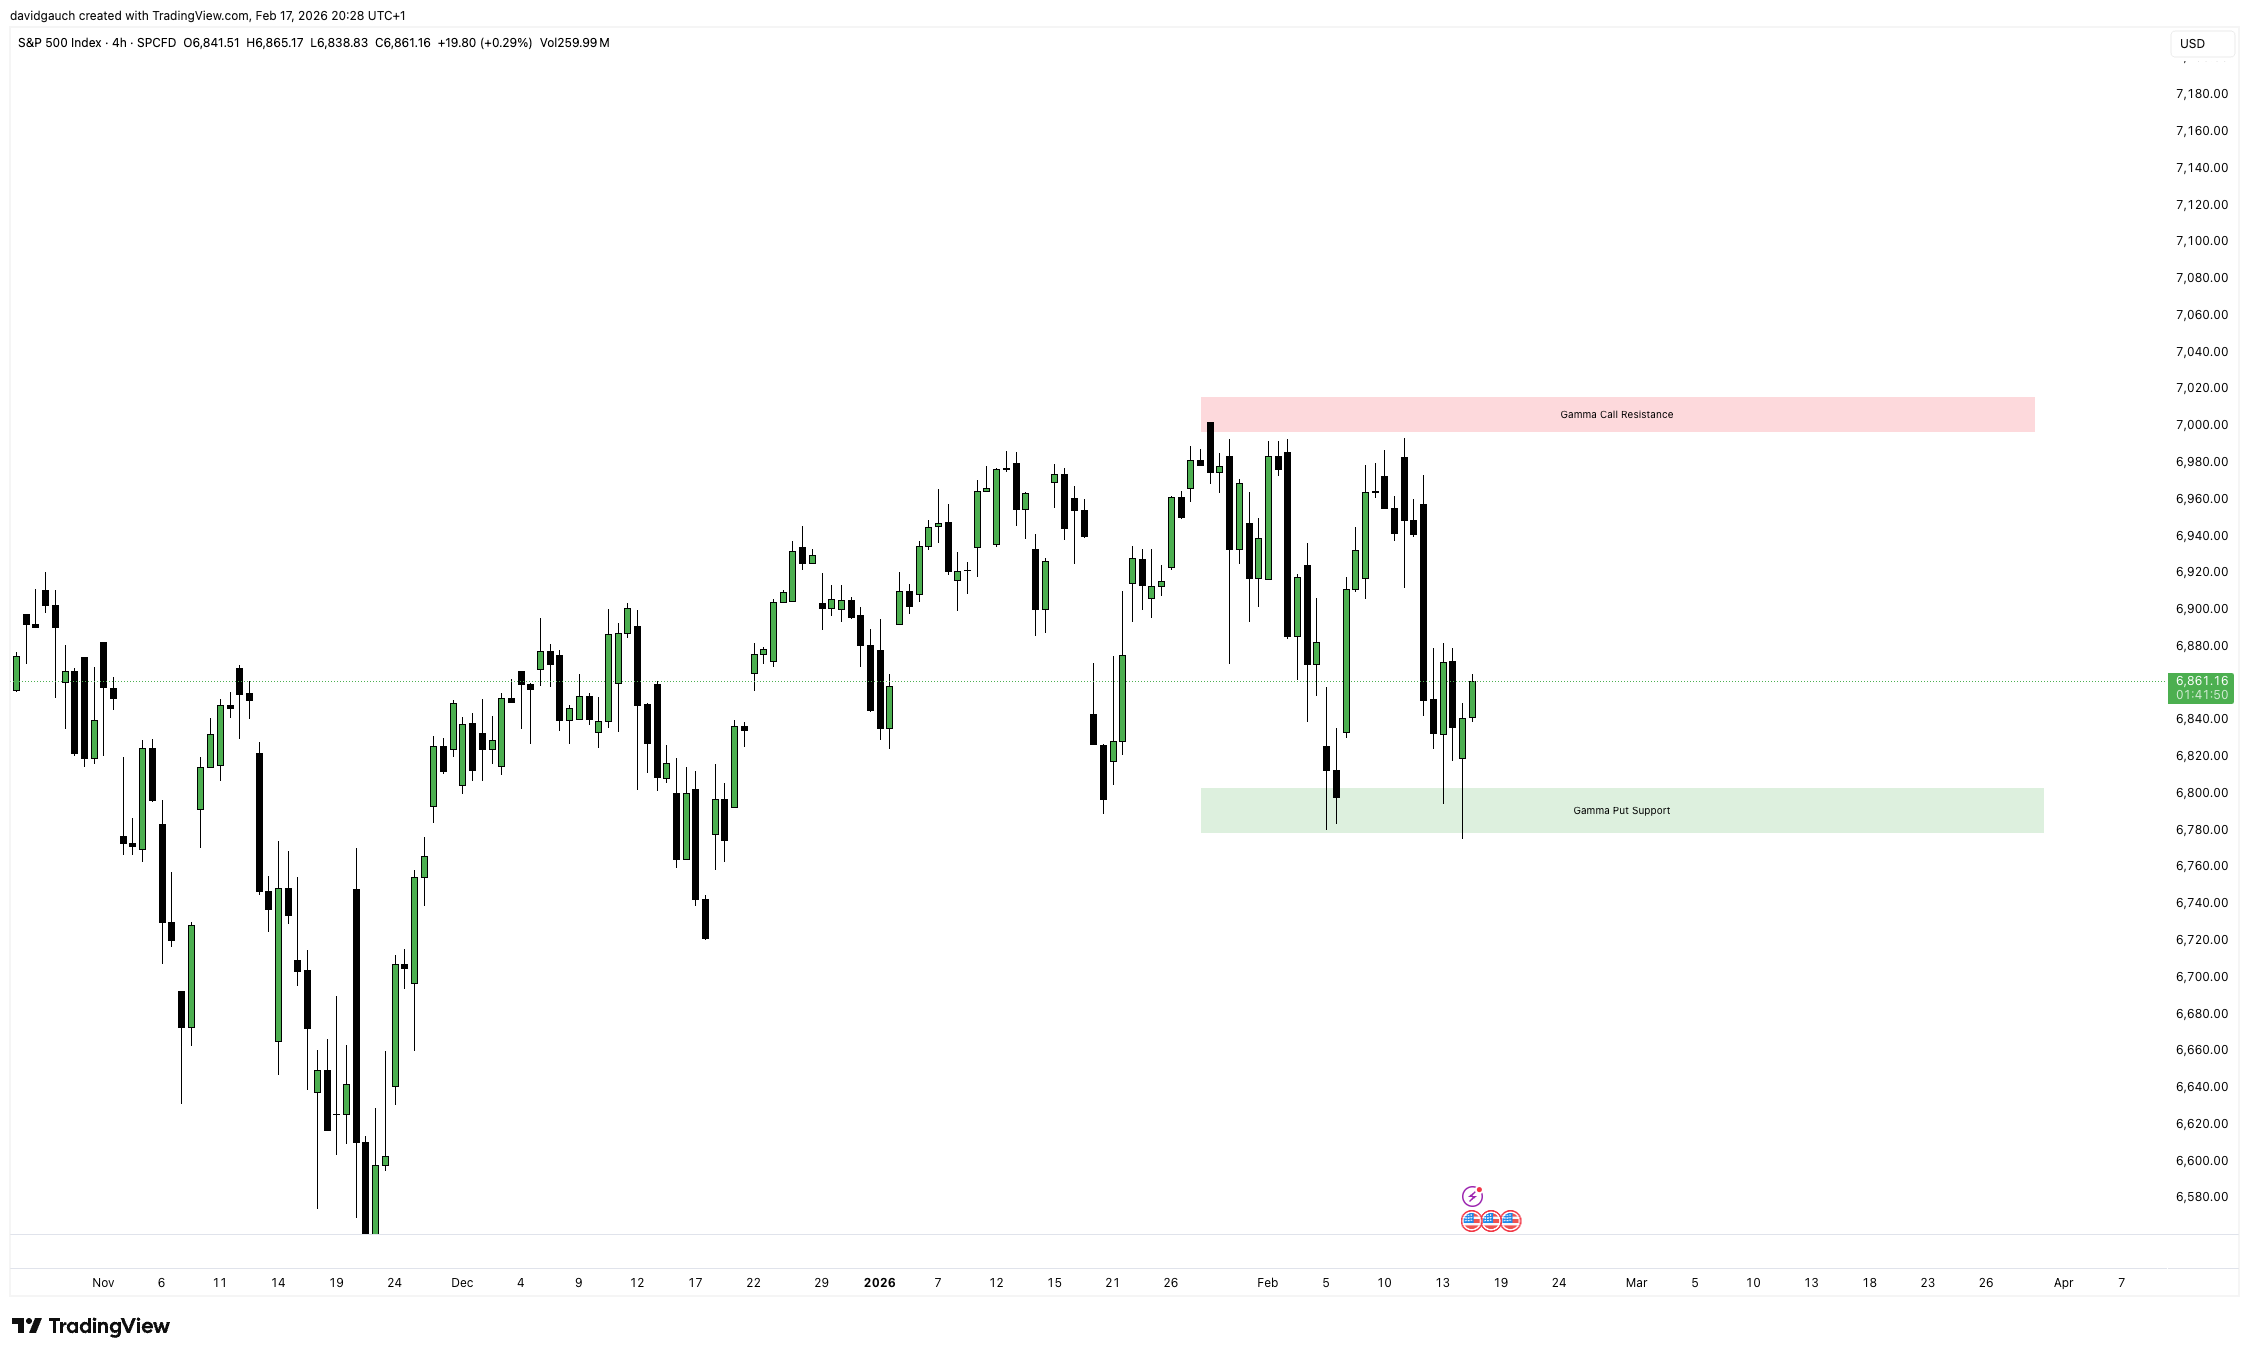
US500
As mentioned at the beginning of the update, this market remains locked in a gamma-driven consolidation between 6,800 and 7,000.
Dealer positioning continues to suppress volatility within that corridor, reinforcing mean-reversion dynamics rather than allowing sustained directional follow-through.
A decisive break of either boundary would be significant. If price manages to push through one of these levels and subsequently confirms the move on a clean retest, that retest could offer a structured opportunity to position in the direction of the breakout.
Until then, the environment remains dominated by hedging flows and range behavior rather than expansion.
Upcoming News
Advance GDP
Core PCE Price Index
Flash PMI’s
Wishing you a successful trading week ahead,
David Gauch
Founder, Gauch Research
Nice post David! Loved it.