
SVC-Update
Weekly Recap & Outlook

Before we begin, I want to make it clear that there are multiple social media accounts impersonating me. I will never contact you directly or attempt to sell any services. This is my only official account.
No financial advice.
The broader market environment has shown little change over recent days and weeks. Geopolitical tensions surrounding the Strait of Hormuz remain elevated, with no clear resolution in sight. However, markets have increasingly moved past headline-driven volatility. The focus has shifted back toward macroeconomic fundamentals and their underlying signals.
Today’s key focus is the latest NFP report, which on the surface appeared relatively solid, but tells a very different story once broken down in detail.
NFP Lookback
April payrolls came in at +115K.
On the surface, this remains consistent with a still stable labor market. However, the internal composition of the report paints a more cautious picture.
The main issue was not the headline figure, but rather the continued negative revisions and weakening breadth.
February payrolls were revised lower again, while March saw only a marginal upward adjustment. This brings the three-month average to approximately +48K jobs per month.
From a macroeconomic standpoint, this is below the level required to sustain a growing economy. Estimates suggest that the US needs roughly +80K to +100K jobs per month simply to keep up with population growth.
In other words, employment growth is no longer keeping pace with structural labor supply.
At the same time, the unemployment rate held steady at 4.3%. However, this stability is increasingly misleading. Labor force participation continues to decline, indicating that more individuals are exiting the workforce rather than actively participating in it.
On the surface, conditions appear stable. In reality, underlying momentum is weakening.
A Labor Market Driven by Narrow Sectors
One of the most important characteristics of the report is the extreme concentration of job creation.
Almost all employment gains in April were driven by a small number of sectors.
Healthcare accounted for nearly half of total payroll growth. However, this is largely structural in nature, driven by demographics, aging populations, and long-term care demand rather than cyclical strength.
Transportation and warehousing also contributed positively, mainly supported by continued growth in delivery and logistics services linked to e-commerce.
Retail employment showed a clear divergence. Discount-focused retailers added jobs, while traditional department stores continued to cut staff. This reflects an ongoing shift in consumer behavior toward value-oriented spending and reduced discretionary consumption.
Combined, these sectors accounted for more than 90% of total job growth.
This level of concentration is not typical of a healthy expansion phase. It reflects an economy that is still functioning, but increasingly reliant on defensive and non-cyclical areas of employment.
Weakness Spreading Across Cyclical Sectors
The deterioration is no longer isolated.
Federal employment continued to decline, reflecting ongoing fiscal tightening and restructuring efforts.
More importantly, weakness is increasingly visible in cyclical private sectors.
The information sector, including software, telecom, and publishing, continued to report job losses. This suggests that the post-pandemic normalization phase is transitioning into a more structural adjustment, driven by automation, efficiency gains, and prior overhiring during the tech cycle.
Manufacturing returned to negative territory. While headline losses remain limited, internal dynamics show more industries cutting jobs than adding workers, which is a more meaningful signal for forward momentum.
Financial services also recorded another month of net job reductions. Given the sector’s sensitivity to credit conditions and liquidity, this is worth monitoring closely.
The Most Important Metric in the Report
One of the most significant data points was not the headline payroll number, but a structural shift in labor utilization:
Part-time for economic reasons surged by +445K in a single month.
Nearly 5 million individuals are now working part-time involuntarily due to reduced hours or inability to secure full-time employment.
Historically, this is one of the clearest late-cycle labor indicators. Companies typically do not begin with layoffs. They first reduce hours, and only later transition into workforce reductions.
This pattern increasingly appears to be underway.
At the same time, newly unemployed individuals increased notably, signaling that labor market stress is not only latent but actively emerging.
Market Interpretation vs Underlying Reality
Markets largely interpreted the report as “soft but manageable.”
The headline number was not weak enough to trigger immediate concern, but the internal structure suggests a more fragile backdrop.
Both major labor indicators are now aligned in showing slower hiring, weaker participation, and deteriorating employment quality.
For several months, divergences between surveys allowed for selective interpretation. That gap is now narrowing.
In addition, the shift from government-related job cuts toward cyclical private sector weakness is particularly important, as it carries stronger recession implications.
There is also a clear deterioration in job quality. Higher-paying sectors continue to lose employment, while lower-paying service sectors absorb job growth. While headline payrolls remain positive, aggregate purchasing power is eroding.
Labour Outlook
The direction of travel in the labor market is becoming increasingly clear.
Hiring breadth continues to weaken.
Labor force participation continues to decline.
Cyclical sectors are now contributing negatively.
And overall job creation remains below replacement-level requirements.
Unless there is a meaningful rebound in hiring activity over the coming months, the probability of a broader economic slowdown in the second half of the year continues to rise.
At present, the labor market is not breaking down in a disorderly way. However, it is gradually losing momentum.
Policy Context
Under normal circumstances, such a labor market profile would strengthen the case for policy easing.
However, monetary policy remains primarily focused on inflation dynamics.
As long as headline payrolls remain stable enough and inflation remains sticky, there is limited incentive for the Federal Reserve to react aggressively to underlying labor weakness.
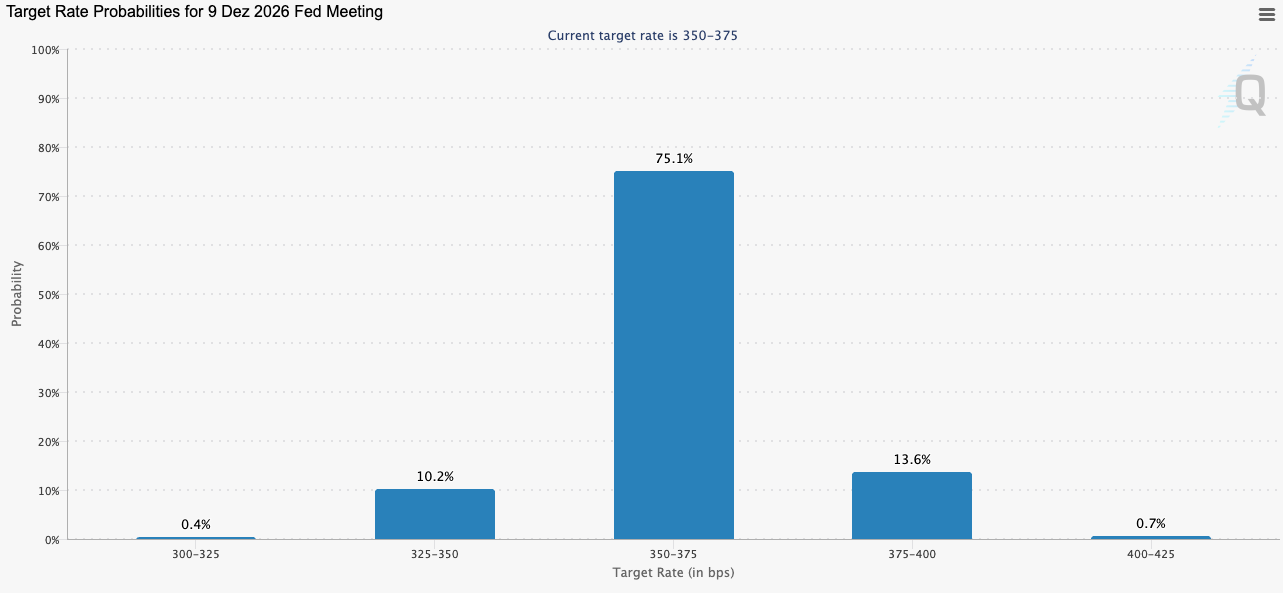
This is why markets did not materially reprice rate expectations following the report.
For now, the key variable remains inflation, and more specifically, the upcoming CPI releases.
If labor market softening continues while inflation gradually eases, markets are likely to begin pricing a more dovish policy path into the second half of the year.
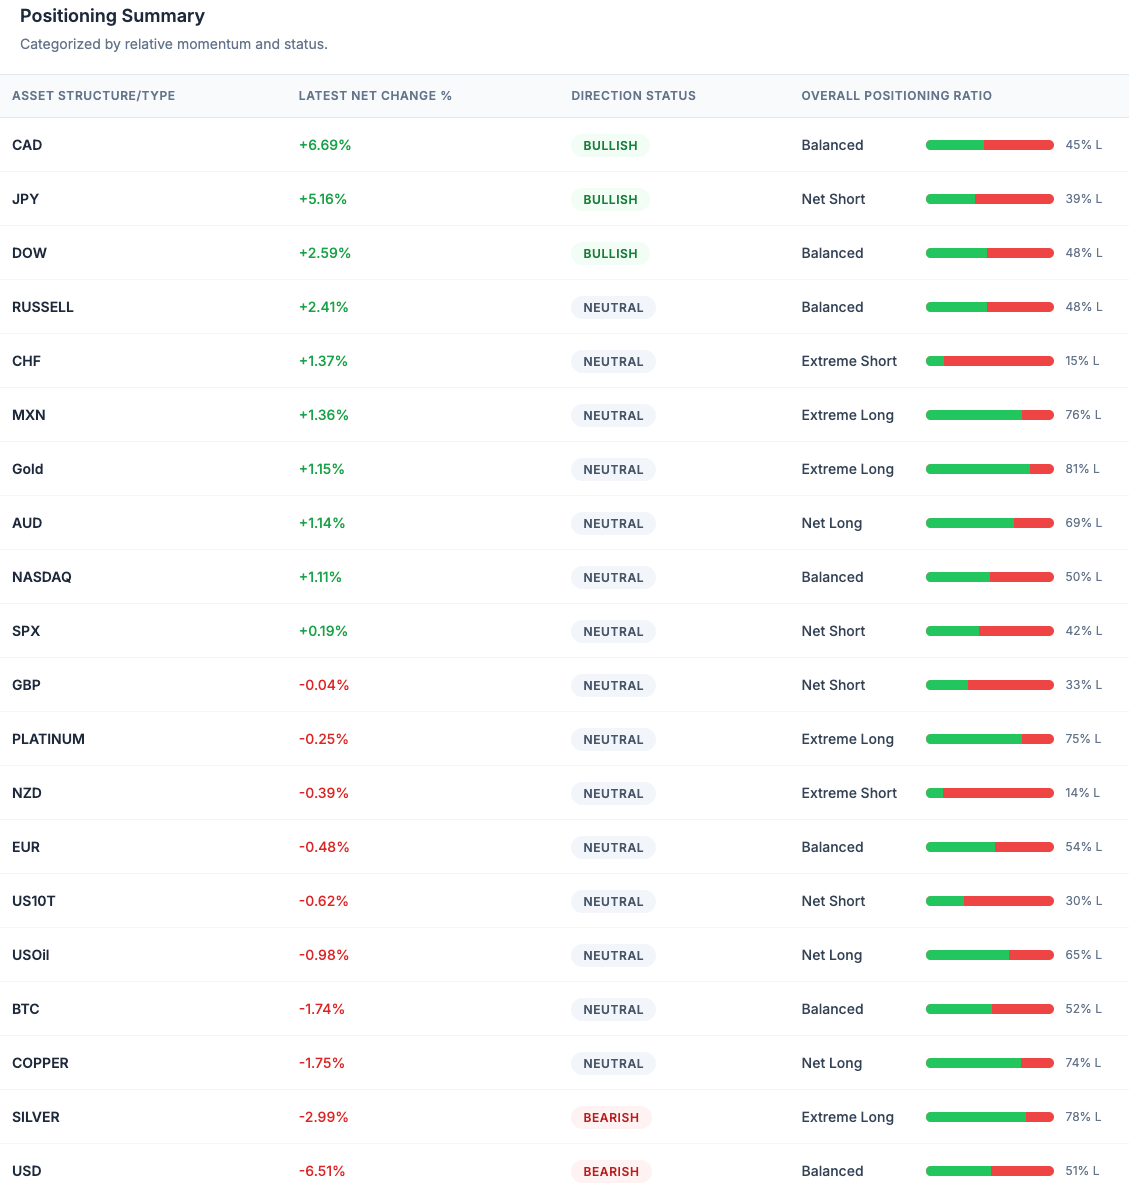
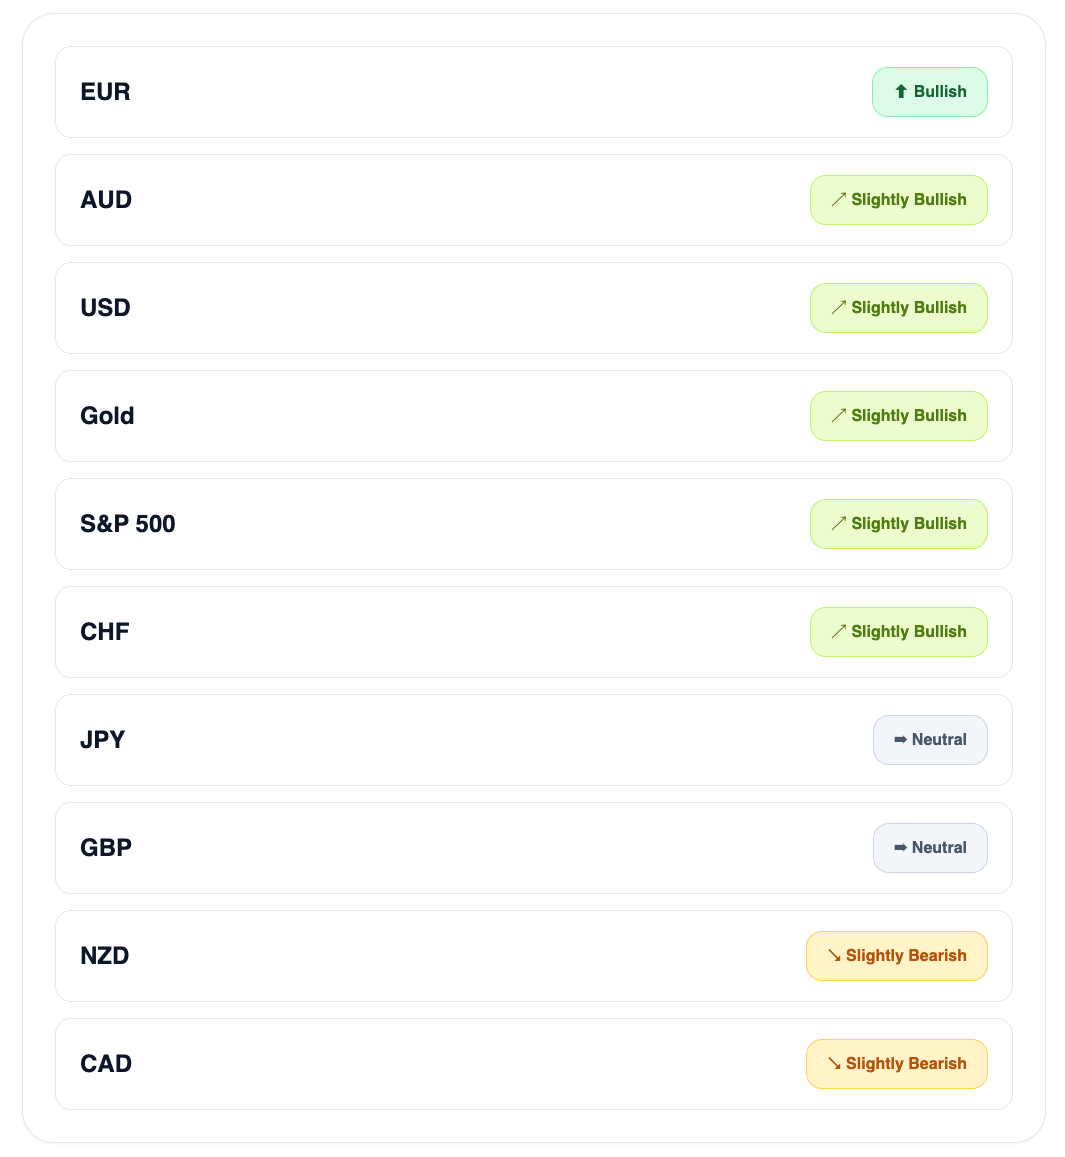
Institutional Positioning
Before turning to this week’s macroeconomic data, below is an overview of recent positioning shifts across major asset classes, based on our proprietary Gauch Research COT Visualizer.
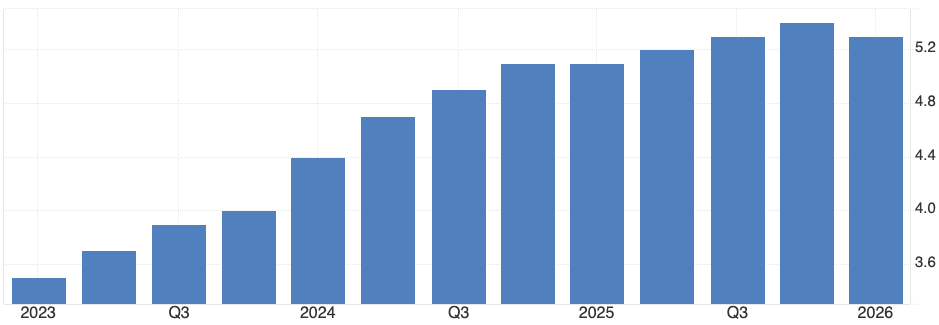
AUD Cash Rate (Previous: 4.10%, Forecast: 4.35%, Actual: 4.35%)
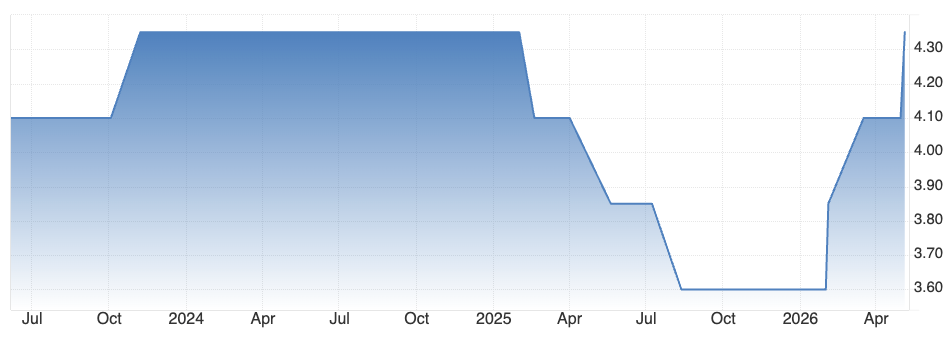
The Reserve Bank of Australia delivered a 25 basis point rate hike, bringing the cash rate to 4.35%, fully in line with market expectations. This marks the third consecutive tightening move in 2026, effectively reversing the easing phase seen in the prior year.
The central bank’s decision was driven primarily by a renewed inflation impulse that has emerged since the second half of 2025 and has continued into 2026. According to the statement, inflation dynamics have been reinforced by both domestic and external factors, with the RBA explicitly highlighting rising capacity constraints within the Australian economy.
A key driver of the inflationary pressure has been the persistent increase in energy-related costs. The ongoing geopolitical tensions in the Middle East, particularly around energy supply routes, have translated into higher fuel and commodity prices. These external shocks have fed through into both business input costs and consumer-facing prices.
The RBA’s updated projections indicate that inflation is expected to peak at a higher level than previously anticipated before gradually moderating. However, this normalization is conditional on demand slowing and supply-side constraints easing over time.
Importantly, the central bank maintained a data-dependent stance, signaling that future policy decisions will remain sensitive to incoming inflation and labor market data. While the tightening bias remains intact, the RBA acknowledged increasing uncertainty around the persistence of external price pressures.
Overall, the decision reflects a policy stance that is increasingly focused on containing second-round inflation effects, even at the cost of slower near-term growth.
ISM Services PMI (Previous: 54.0, Forecast: 53.7, Actual: 53.6)
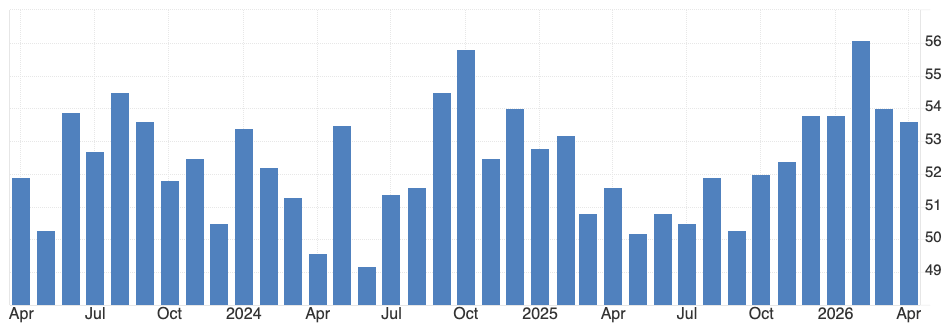
The ISM Services PMI edged lower to 53.6 in April 2026, slightly below the previous reading of 54.0 but broadly in line with expectations. Despite the marginal decline, the index remains firmly in expansionary territory, indicating continued growth in the US services sector.
The underlying components, however, present a more nuanced picture. Business activity and output rose to 55.9, suggesting that core service demand remains relatively resilient. This increase was largely attributed to sustained operational activity despite higher input costs and ongoing external shocks.
A notable divergence emerged within demand indicators. New orders declined significantly by 7.1 points to 53.5, signaling a cooling in forward-looking demand momentum. At the same time, the backlog of orders improved slightly, suggesting that existing demand is still being processed, but fresh inflows are moderating.
Employment remained weak, registering below the 50 expansion threshold for the second consecutive month. Although it improved modestly to 49.4, the reading continues to indicate contraction in services employment, pointing to a labor market within the sector that is losing momentum.
One of the most significant developments was the continued rise in price pressures. The prices paid component surged to 70.7, the highest level since 2022. Survey respondents attributed this increase to higher fuel, energy, freight, and raw material costs. Additional upward pressure stemmed from commodity-specific inflation in metals and construction-related inputs, as well as tariff-related cost increases.
Overall, the report reflects an economy where services activity remains stable, but inflationary pressures and demand deceleration are increasingly visible beneath the surface. The combination of weakening new orders, persistent price acceleration, and soft employment suggests a gradual transition toward a lower growth environment with sticky input cost inflation.
NZ Unemployment Rate (Previous: 5.4%, Forecast: 5.4% Actual: 5.3%)
New Zealand’s unemployment rate declined slightly to 5.3% in the March 2026 quarter, marking a modest improvement from the previous reading of 5.4% and coming in marginally below expectations.
The decline in unemployment was primarily driven by a small reduction in the number of unemployed individuals, which fell by approximately 2,000 to 163,000. At the same time, employment increased by 4,000 to 2.89 million, contributing to a slight improvement in headline labor market conditions.
Despite this improvement, broader labor market indicators continue to suggest underlying slack. The employment rate remained unchanged at 66.7%, indicating that gains in employment are not materially shifting overall participation dynamics.
More importantly, the labor force participation rate edged lower to 70.4%, slightly below both the previous quarter and expectations. This decline suggests that a portion of the working-age population is gradually exiting the labor force, rather than actively seeking employment. From a structural perspective, this can partially offset increases in unemployment and distort the apparent strength of the labor market.
The underutilization rate, which captures broader spare capacity in the labor market, stood at 12.9%, remaining elevated compared to the same period last year. This indicates that while headline unemployment has improved modestly, there is still a significant share of underemployed or marginally attached workers.
Overall, the data points to a labor market that is stabilizing at the margin, but still operating with elevated slack. The improvement in unemployment is not yet accompanied by a meaningful acceleration in participation or broad-based labor demand.
CAD Unemployment Rate (Previous: 6.7%, Forecast: 6.7% Actual: 6.9%)
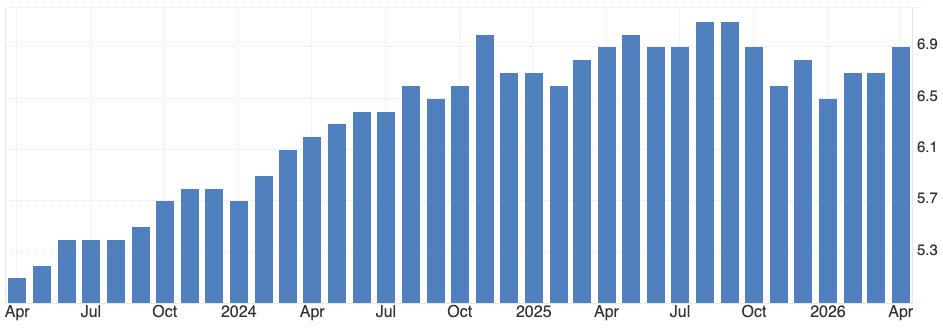
Canada’s unemployment rate rose to 6.9% in April 2026, marking the highest level in six months and coming in above both the previous reading and market expectations.
The increase was driven primarily by a rise in the number of unemployed individuals, which increased by 51,200, or 3.4%, to 1.566 million. This reflects a combination of both job losses and increased labor market entry, suggesting rising difficulty in absorbing new entrants into employment.
At the same time, the labor force expanded by 33,500, indicating that more individuals are actively seeking employment. This pushed the labor force participation rate slightly higher to 65%, which partially offsets the rise in unemployment but does not change the underlying trend of softening labor demand.
Net employment declined by 17,700, missing expectations for a modest gain. This unexpected contraction highlights weakening momentum in job creation and suggests that labor demand is beginning to cool more visibly.
A notable feature of the report is the stability in long-term unemployment. The share of individuals unemployed for more than six months remained at 22.5%, significantly above the long-term average of 17.1%. This indicates that a meaningful portion of unemployed workers is experiencing prolonged difficulty in re-entering the labor market.
The monthly layoff rate remained steady at 0.6%, consistent with pre-pandemic norms. However, the combination of rising unemployment and declining net job creation suggests that labor market conditions are gradually deteriorating rather than experiencing a sharp downturn.
Overall, the Canadian labor market is entering a phase of gradual softening, characterized by rising unemployment, weak net job creation, and stable but elevated structural unemployment measures.
Summary & Outlook
Upcoming News
US CPI
US PPI
Fed Chair Nomination Vote
UK GDP
US Retail Sales
Wishing you a successful week ahead,
David Gauch
Founder, Gauch Research