
Market Update
08.07.2025

It’s been a while since my last market update and since then, a lot has happened.
We’ve seen post-Liberation Day panic due to tariff frontloading, a sharp market selloff, a brief brush with what some dubbed "WW3", the Fed Chair publicly labeled “Mr. Too Late” by the U.S. President, the passing of the OBBB… and that’s just scratching the surface.
In times like these, markets can be humbling and if you’ve felt a bit overwhelmed, you’re not alone. My goal with this update is to cut through the noise and bring some clarity by focusing on the real drivers: macroeconomic data and structural trends.
New Highs Despite Lingering Uncertainty
With the worst of the geopolitical tension seemingly behind us (for now), the S&P 500 has surged to new all-time highs, while commodities like oil and gold are losing momentum, a classic Risk-On signal.
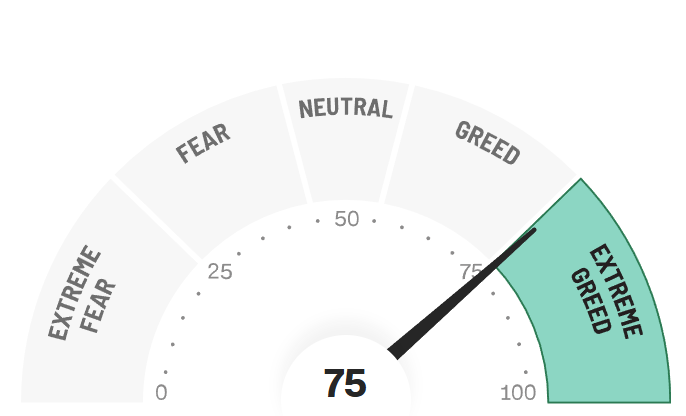
That said, uncertainty over tariffs has re-entered the conversation, and with equities hovering near highs and the Fear & Greed Index sitting at 75, we should remain cautious. Volatility is still on the table.
However, I believe the most volatile phase of the recent trade uncertainty is behind us. Any further shocks may result in minor pullbacks, potential buying opportunities, depending on your strategy (this is not financial advice!).
What the Data Tells Us
Rather than reacting to every headline, let’s take a step back and review the most important economic data from the past few weeks:
Final GDP (Q1):
Actual: -0.5% | Previous: -0.2%
While the headline number is alarming, the result was largely expected following the Advance and Preliminary releases. A deeper dive into the data tells a more nuanced story, not quite as dire as it looks on the surface.
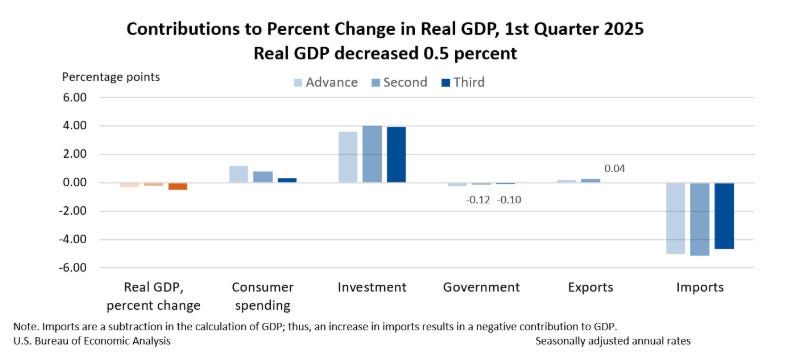
I wrote a dedicated blog post on this, explaining why some GDP data points can be misleading. If you're interested, check it out here.
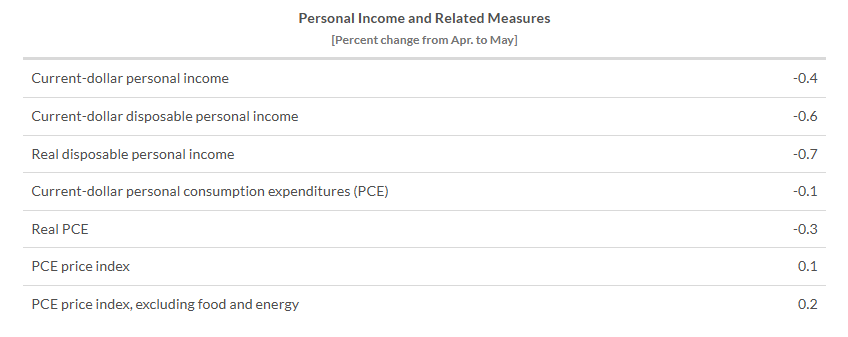
Core PCE Price Index (May):
Actual: +0.2% | Previous: +0.1%
The Core PCE, the Fed’s preferred inflation measure, rose 2.7% year-over-year (excluding food and energy). Overall PCE rose 2.3%.
Despite ongoing tariff concerns, we’re not seeing the feared spike in consumer prices, at least not yet.
Flash Manufacturing PMI:
Actual: 52.0 | Previous: 52.0
Flash Services PMI:
Actual: 53.1 | Previous: 53.7
Both indices remain above 50, signaling continued expansion. While not the strongest numbers globally, they do show resilience, especially compared to other major economies that are seeing contractions.
Labor Market Snapshot:
Non-Farm Payrolls: 147K (vs. 144K previously)
Average Hourly Earnings: +0.2% (vs. +0.4%)
Unemployment Rate: 4.1% (vs. 4.2%)
These figures don’t scream “recession”, quite the opposite. After the NFP release, traders quickly adjusted rate expectations: now pricing in only 2 rate cuts this year, down from 3 previously.
Despite the noise and political drama, the U.S. economy is holding up surprisingly well.
Market Implications & Personal Take
The passing of the OBBB felt like a “sell the news” moment, largely priced in ahead of time. From my perspective, the U.S. Dollar had become overly sold and was ripe for a technical retracement, which we’ve already started to see.
If political interference stays in check, I could see further USD strength, possibly pushing back toward the DXY 100 level.
As for EUR/USD, I wouldn’t be surprised to see some downward pressure toward the 1.12 area.
In equities, I’d be cautious at all-time highs but would consider buying dips in the -5% range, as long as the macro backdrop remains stable and no major catalysts hit the markets.
Again, these are just my personal views, not financial advice.
Final Thoughts
If the past year has taught us anything, it’s that we’ve all had to become part-time geopolitical and fiscal analysts. But now, it’s time to refocus on what truly matters: macro fundamentals.
I hope this update has brought some clarity or at least given you a fresh perspective. If you found it helpful, feel free to share it, the financial world is noisy enough and thoughtful insights can go a long way.
Stay sharp and unlock alpha with Gauch-Research. 🚀