
Market Update
07.09.2025

This Week’s Market Outlook “We might be behind the Curve…”
Hello again, dear friend and reader. Welcome back. Last week’s data painted a picture of growing weakness in the U.S. economy. The key question now: are we merely slowing down, or is the Fed once again behind the curve, risking a harder landing than expected? Let’s break it all down step by step, enjoy.
Latest Data and News in Review – What Moved the Markets?
Friday’s Non-Farm Payrolls (NFP) report added fuel to growing concerns about the health of the labour market.
Only 22,000 jobs were created in August, far below expectations
Unemployment rate climbed to 4.3%, its highest level since the post-pandemic recovery began
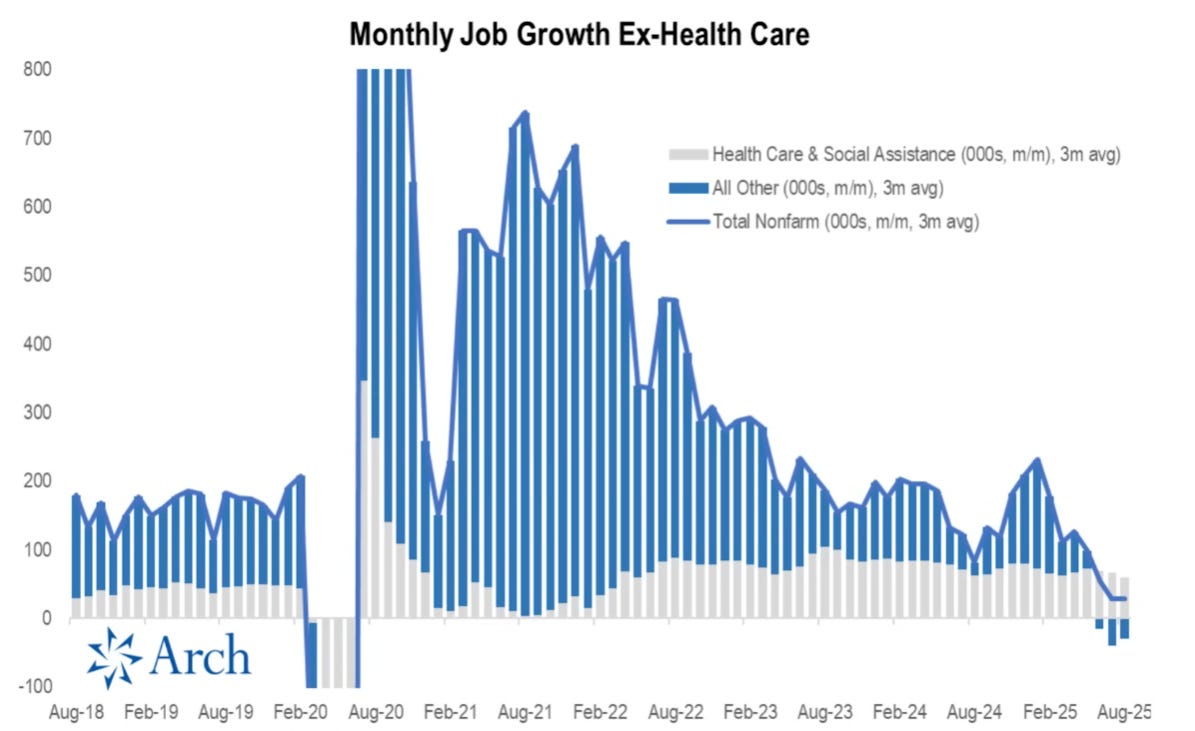
At first glance, these numbers are alarming. They confirm what many market participants have been fearing: The labour market is losing momentum at an accelerating pace. When looking at the details, the picture becomes even more concerning. Healthcare remains the only sector still adding jobs, while most other industries are now shedding positions, a clear sign of broad-based weakness.
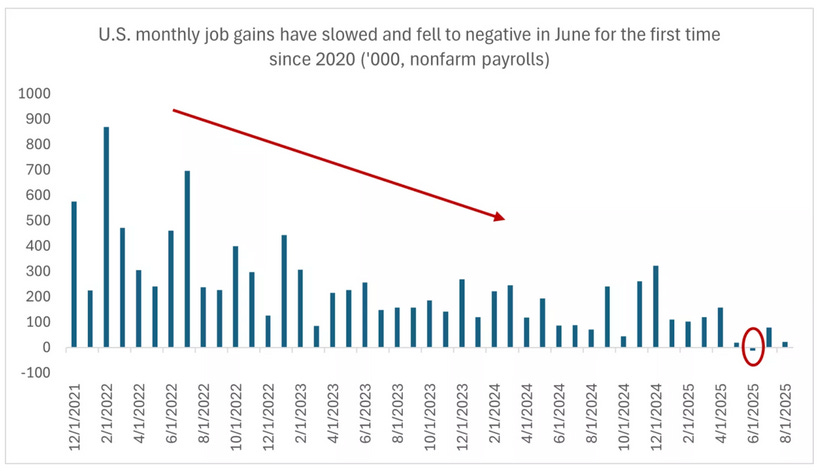
Along with this report came the latest revisions to previous months, and once again, they were negative. June data showed negative job growth, marking the first monthly decline since the pandemic. This tells us the slowdown isn’t just a sudden event, it’s been quietly building for months, only now becoming visible in the headline figures.
This realization sent shockwaves through the market. Initially, equities surged right after the NFP release on hopes of more aggressive rate cuts. But that optimism quickly evaporated as traders processed the full extent of the data. The takeaway was clear: The U.S. economy isn’t just slowing, it’s at a low point, and the risk of slipping into recession territory is rising. With these latest figures, the market’s expectations for monetary policy shifted dramatically:
25 bps cut in September → fully priced in
50 bps cut → probability now at 11%, and could increase significantly if next week’s PPI and CPI numbers come in softer than expected
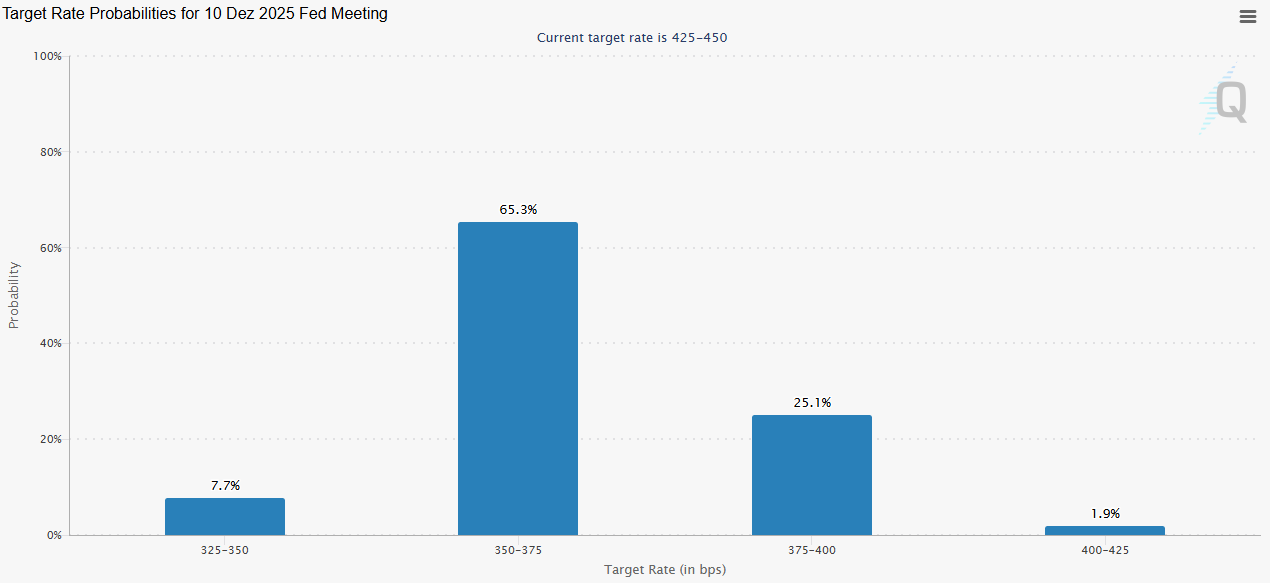
Looking further ahead, markets now price in three 25 bps cuts by year-end, with a cumulative probability of roughly 65%.
Whenever economic uncertainty intensifies, investors turn to safe havens.
Gold surged to fresh all-time highs last week, driven by a mix of risk aversion and expectations for aggressive Fed easing.
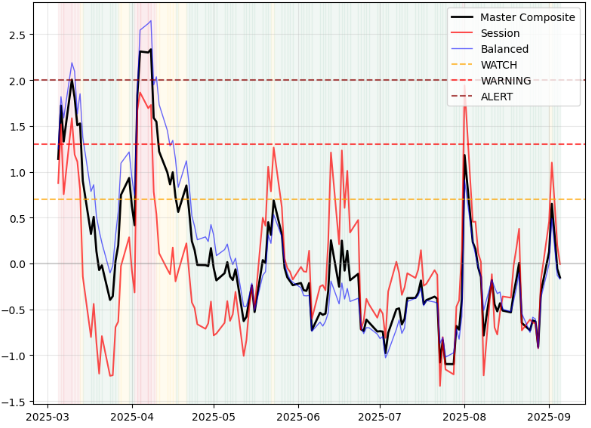
At the same time, our Gauch-Research Risk Meter remained relatively calm, for now.
This proprietary Composite Index, built on 23 different indicators, tracks overall market and risk sentiment.
What’s Coming Up This Week?
This week’s calendar brings several critical data releases that could further impact the market:
Wednesday: PPI → Key indicator for September rate cut sizing
Thursday: CPI → The most important release of the week
Thursday: ECB Rate Decision + Press Conference → Watch the tone closely
Friday: UoM Consumer Sentiment & Inflation Expectations → Secondary importance, but still relevant for sentiment trends
The PPI and CPI reports will be decisive. If both numbers surprise to the downside, the probability of a 50 bps cut in September could rise further, potentially igniting volatility across asset classes.
Institutional Positioning:
Bullish:
Silver
CHF
AUD
US10T
Russel
Bearish:
CAD
JPY
Nikkei
Dow
Nasdaq
Let’s Talk Charts:
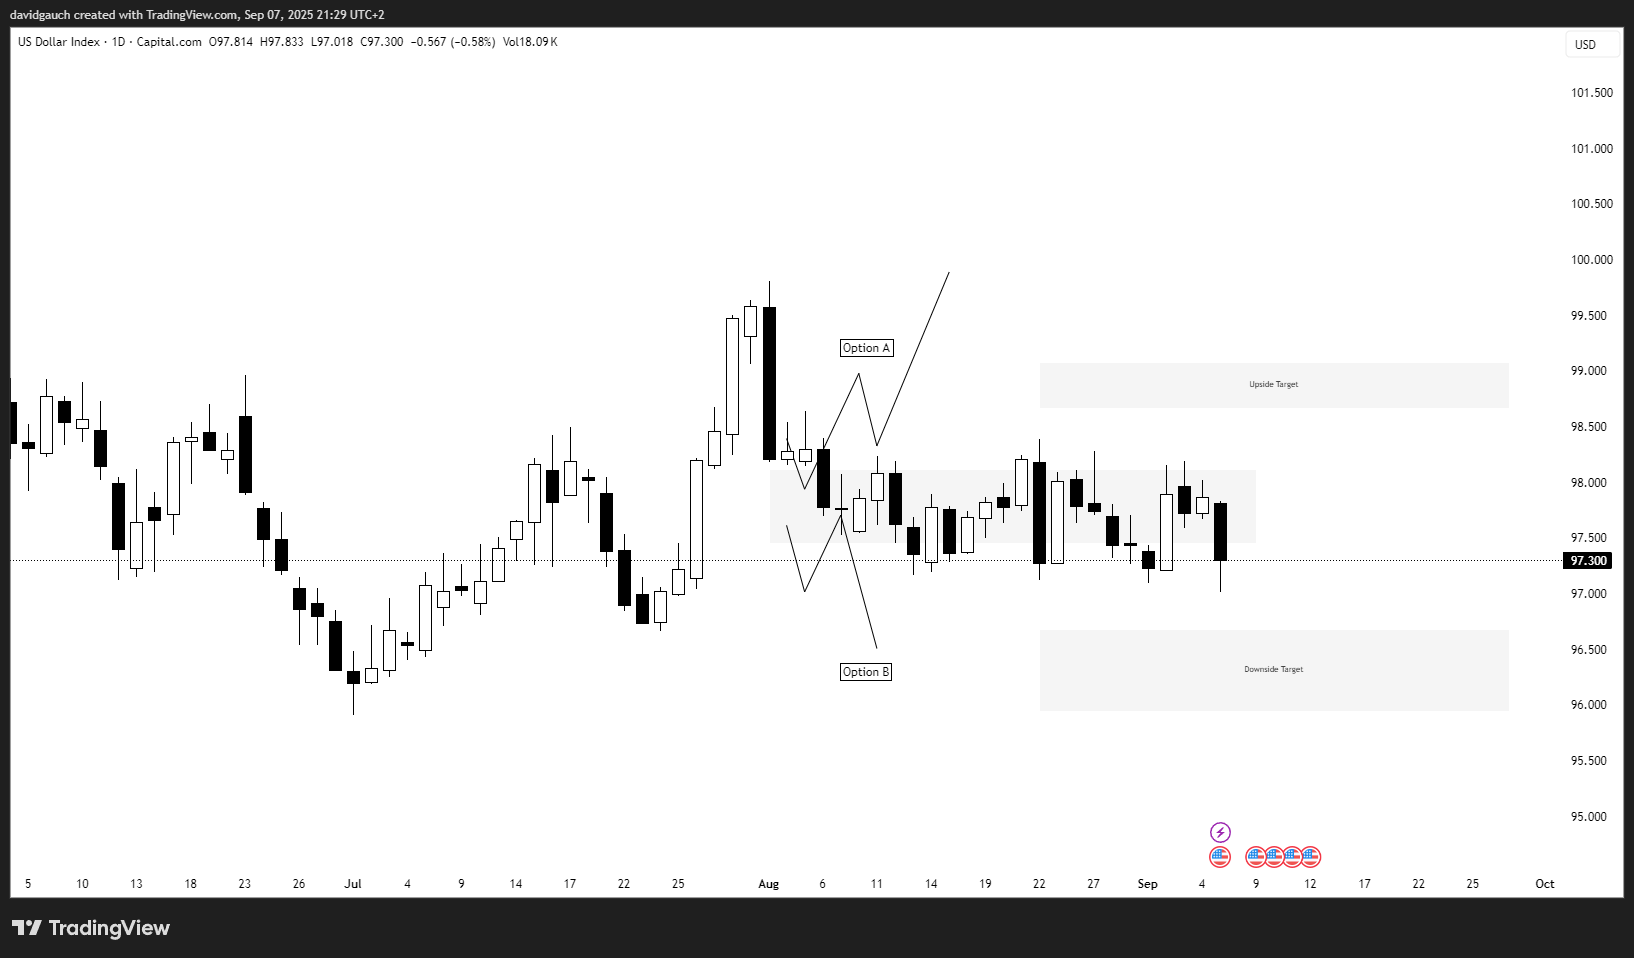
USD:
Option B still in play, first target will be to the downside
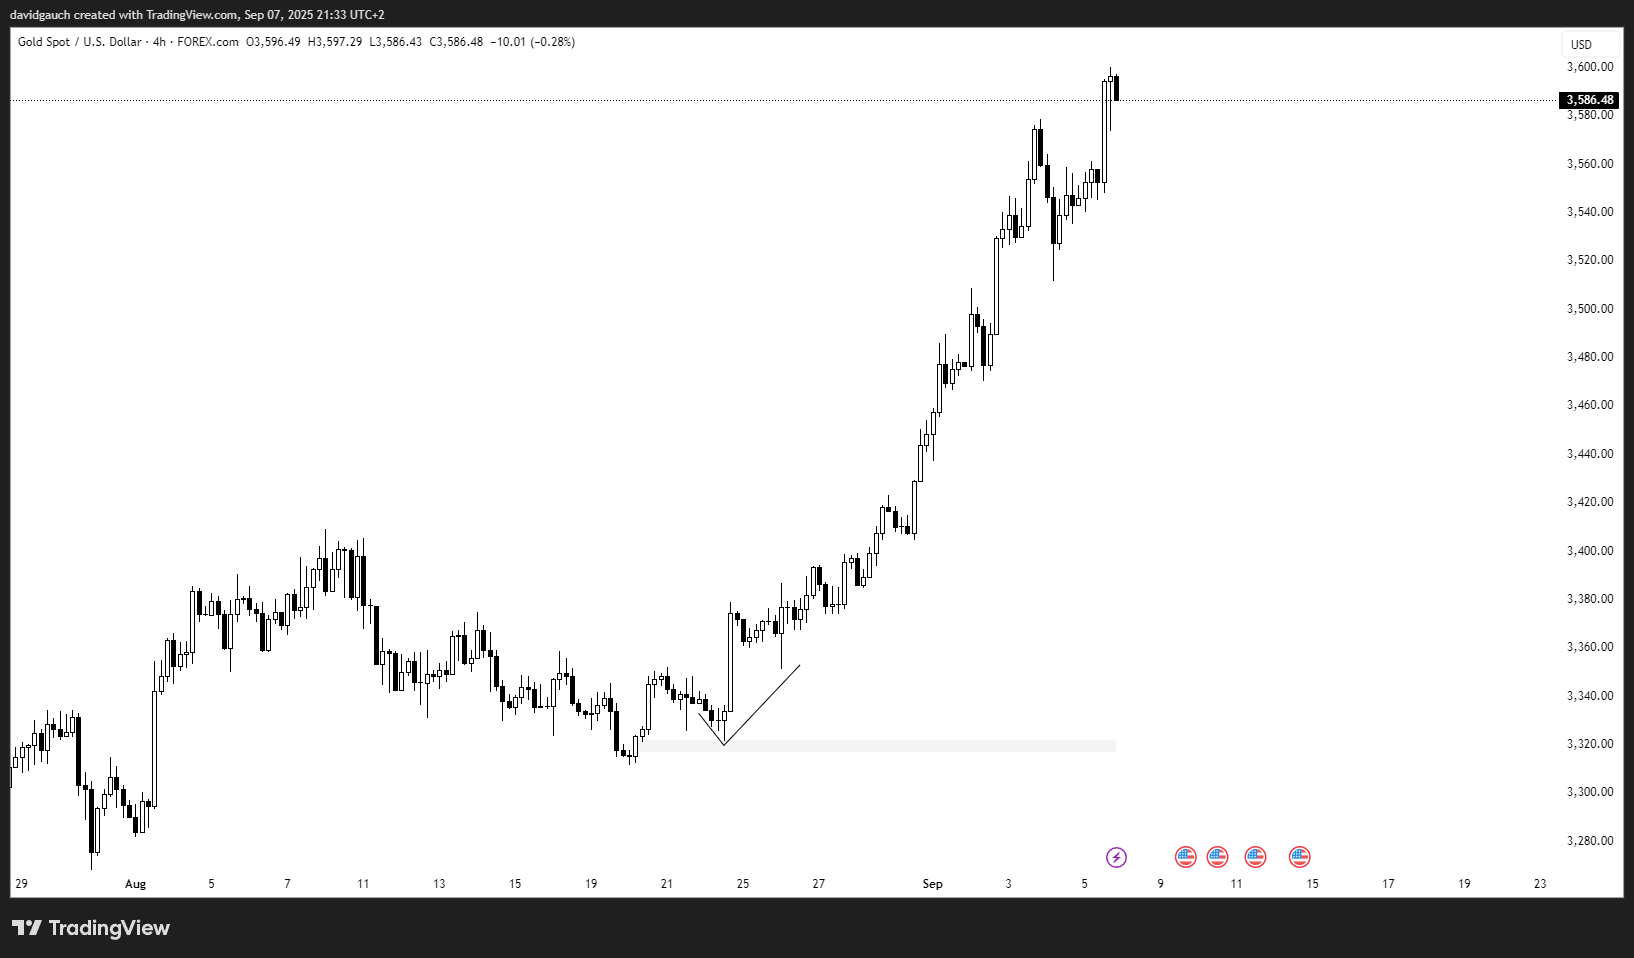
Gold:
Latest gold trading idea from our Premium Subscriber Chat played out clean (First Image)
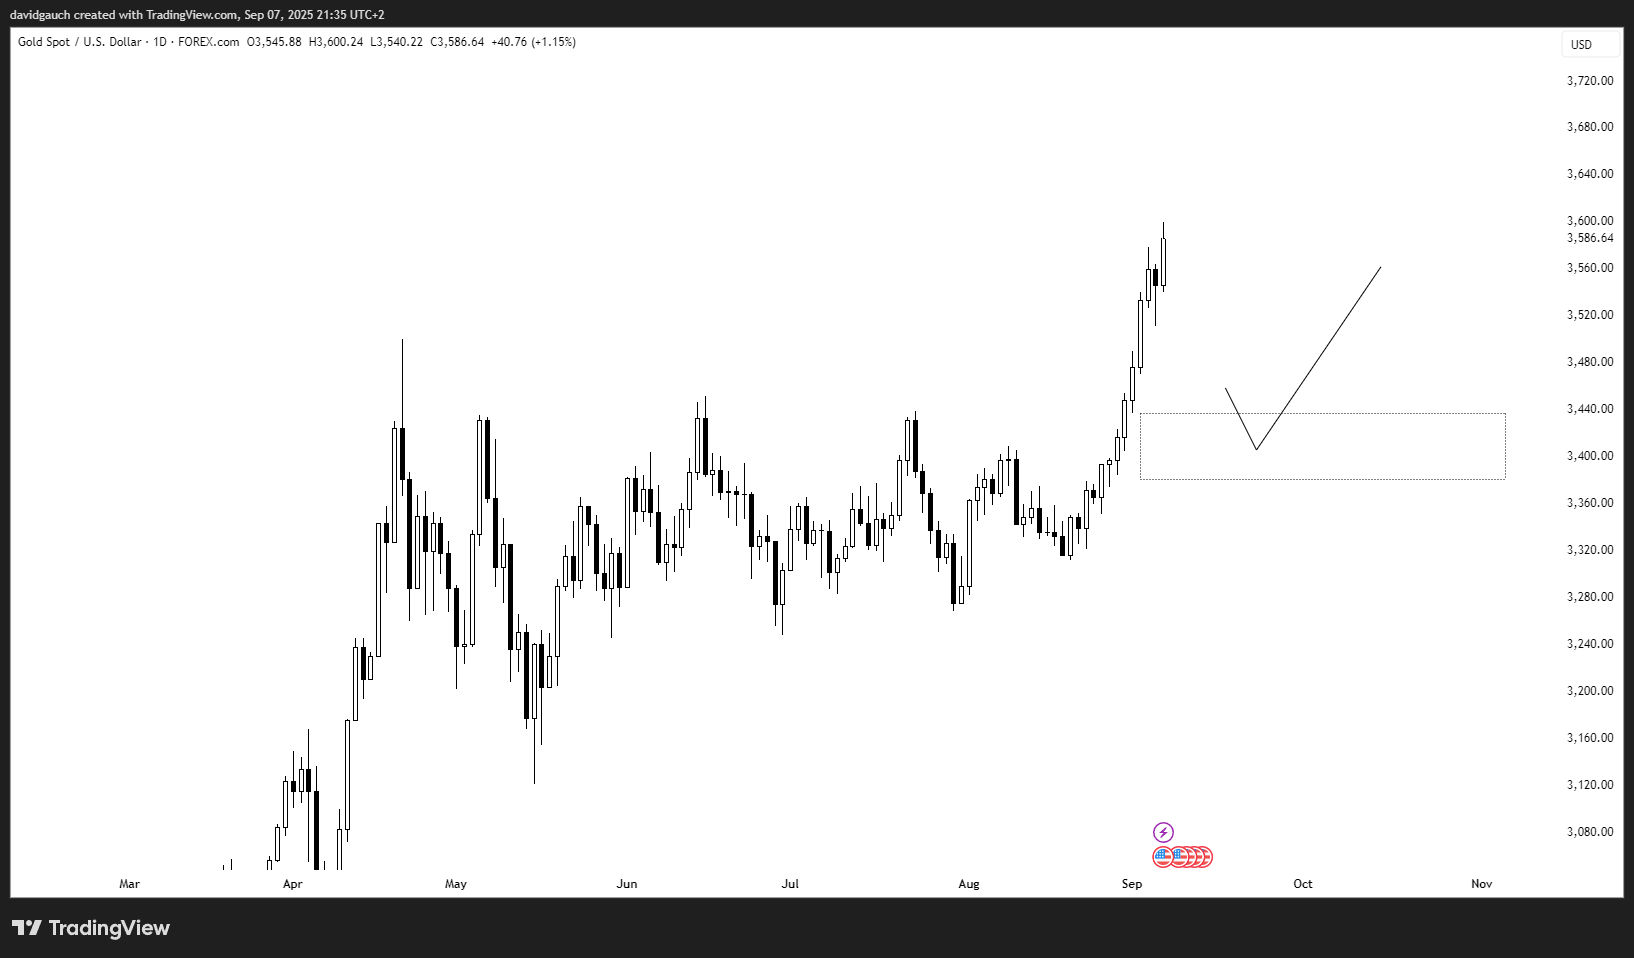
Further aiming for the upside, potential entries on the 3450 level for swing ideas
Stay informed and unlock alpha with Gauch-Research. 🚀
👏